
← Choosing how to build it (Solutions)
How do I compare Solutions in a VDT?
Short answer
Press + New in Plan, choose Value Decision Table, type a tag, press Create, + Add Ends & Means, search and select Values and Solutions.
Before you start
You need to be signed in to GilbApp on a computer, with a vault you can write to, such as your own vault. The Values and Solutions to compare must exist, each Value with Status, Tolerable and Goal numbers. For the ratios, you also need a Development Resource with Status and Budget. The pictures show a made-up person on a test site; your screen shows your own name and address.
Words used here (9)
- Value Decision Table
- A Value Decision Table (VDT) is a table that ranks options by how much they move the level's Values for their cost.
- GilbApp
- GilbApp is the app, opened in a web browser at https://gilb.com/app, where you open, fill and share your vaults.
- Budget
- A Budget is the most of a Development Resource you plan to use, such as the money for one month.
- Kai-Zen
- Kai-Zen is the planning agent: it finds out what you want, chooses the way, hands the work to other agents and reports back.
- record
- A record is one piece of data with its own address, such as a person, a place, a thing or a note.
- virtual folder
- A virtual folder is a view that groups records and files without moving them; each may sit in several folders.
- Value Kick-out Table
- A Value Kick-out Table (VKT) is a table that picks one of several options by how much Value each gives for its cost.
- short name
- A short name is the one word you give one AI on one computer, such as gilb-example; it keeps that AI's key and tools apart.
- Experience Level
- An Experience Level is a whole number from 0 to 10, chosen under an impact, that says how much experience stands behind its number.
Steps
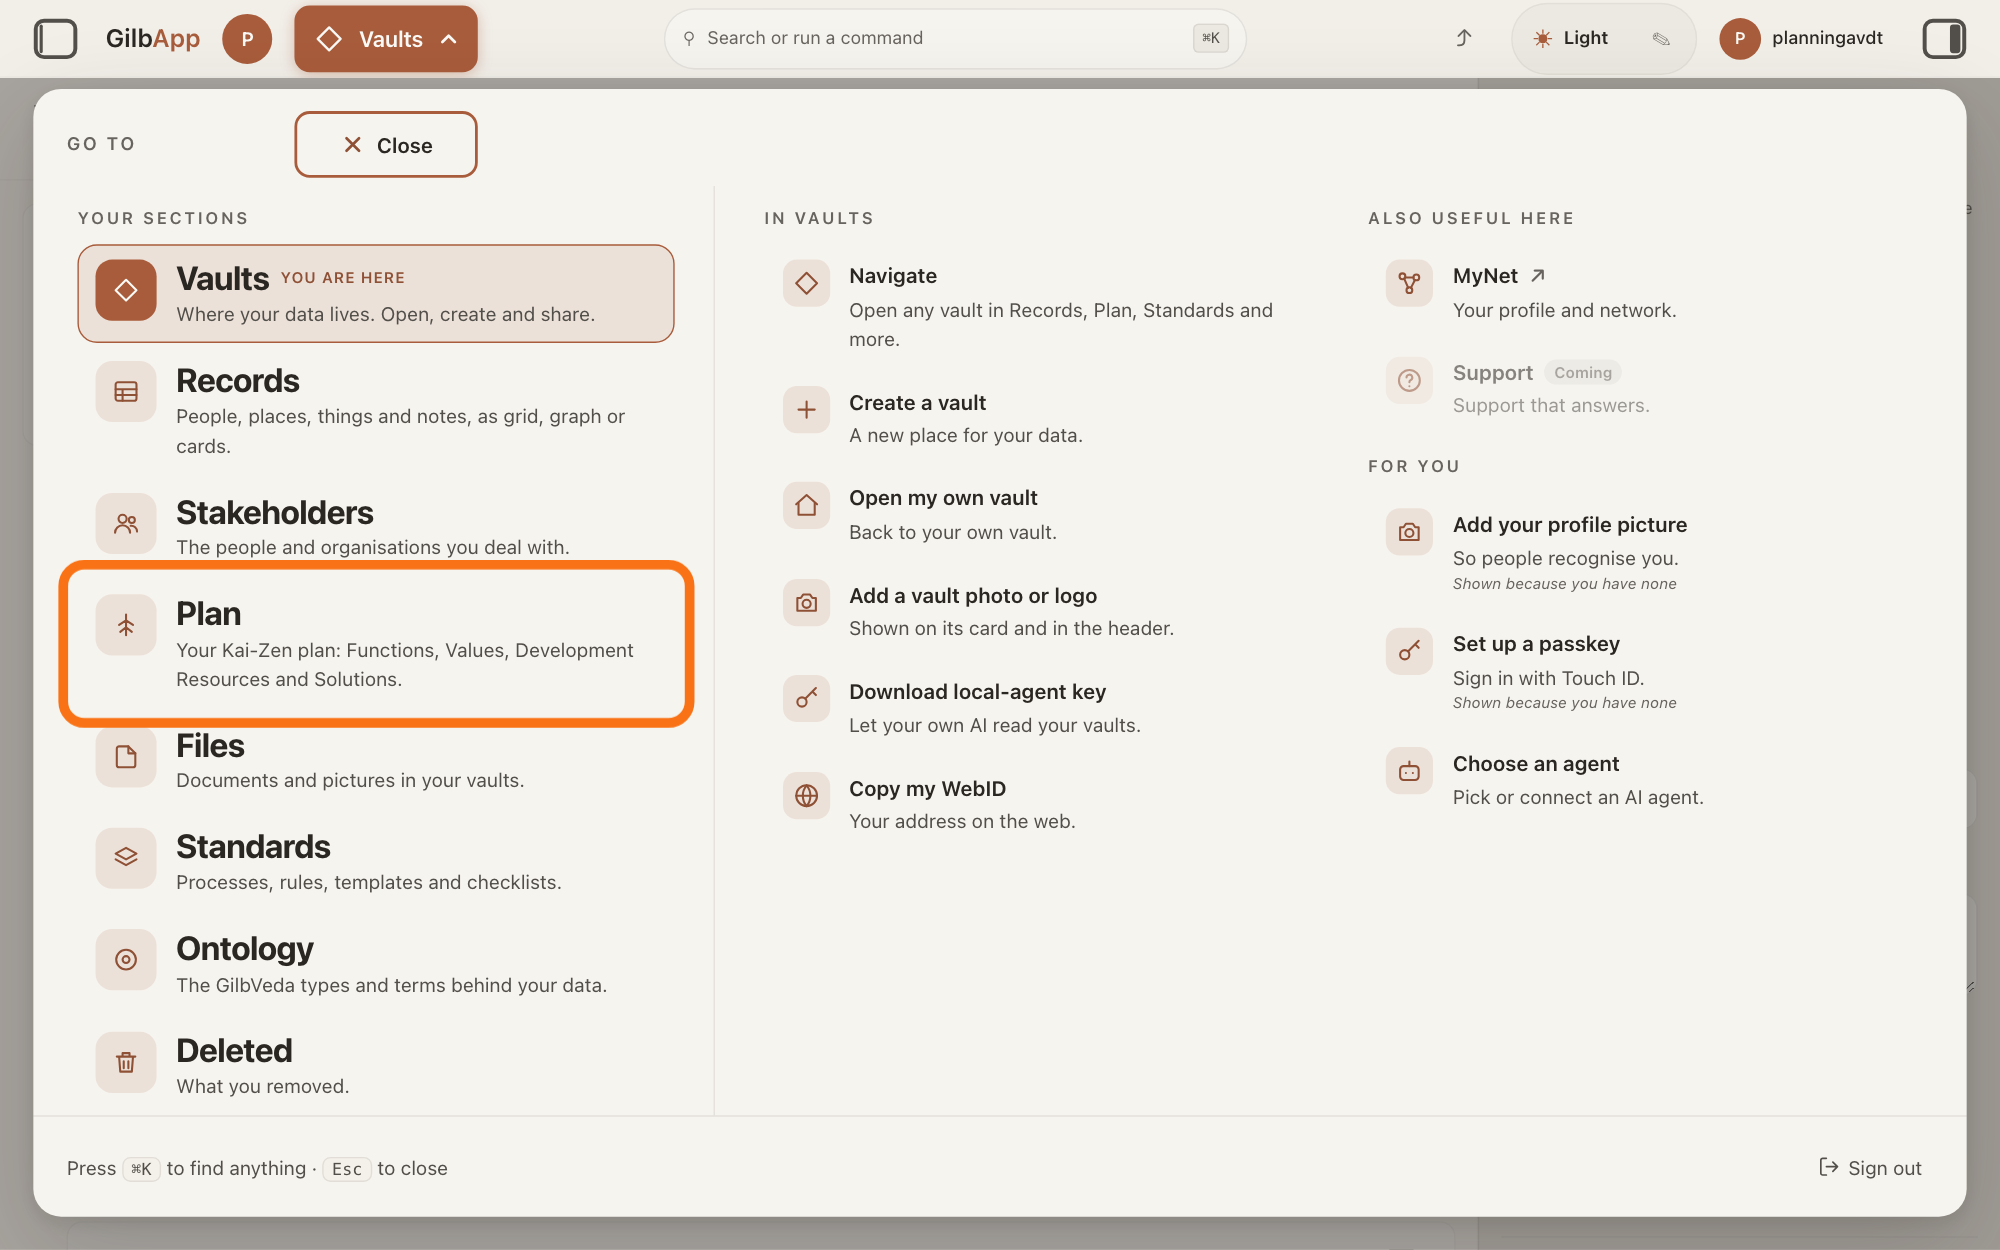
Press Main menu at the top left and choose Plan.
Press Main menu, next to your profile picture at the top left, and under YOUR SECTIONS choose Plan. The button shows the name of the section you are in, such as Vaults.
Show as text
The "GO TO" panel is open over the screen. Look in the left column under "YOUR SECTIONS": the outlined row is "Plan", with the line "Your Kai-Zen plan: Functions, Values, Development Resources and Solutions." Press it to open the Plan screen.
More about this
A panel headed GO TO opens; Plan reads Your Kai-Zen plan: Functions, Values, Development Resources and Solutions. You can also press the Plan button on the card of a vault (the place where a person or a group keeps their records) in Vaults. The Plan screen lists your plan records and has the views Grid, Graph, Both and Card.
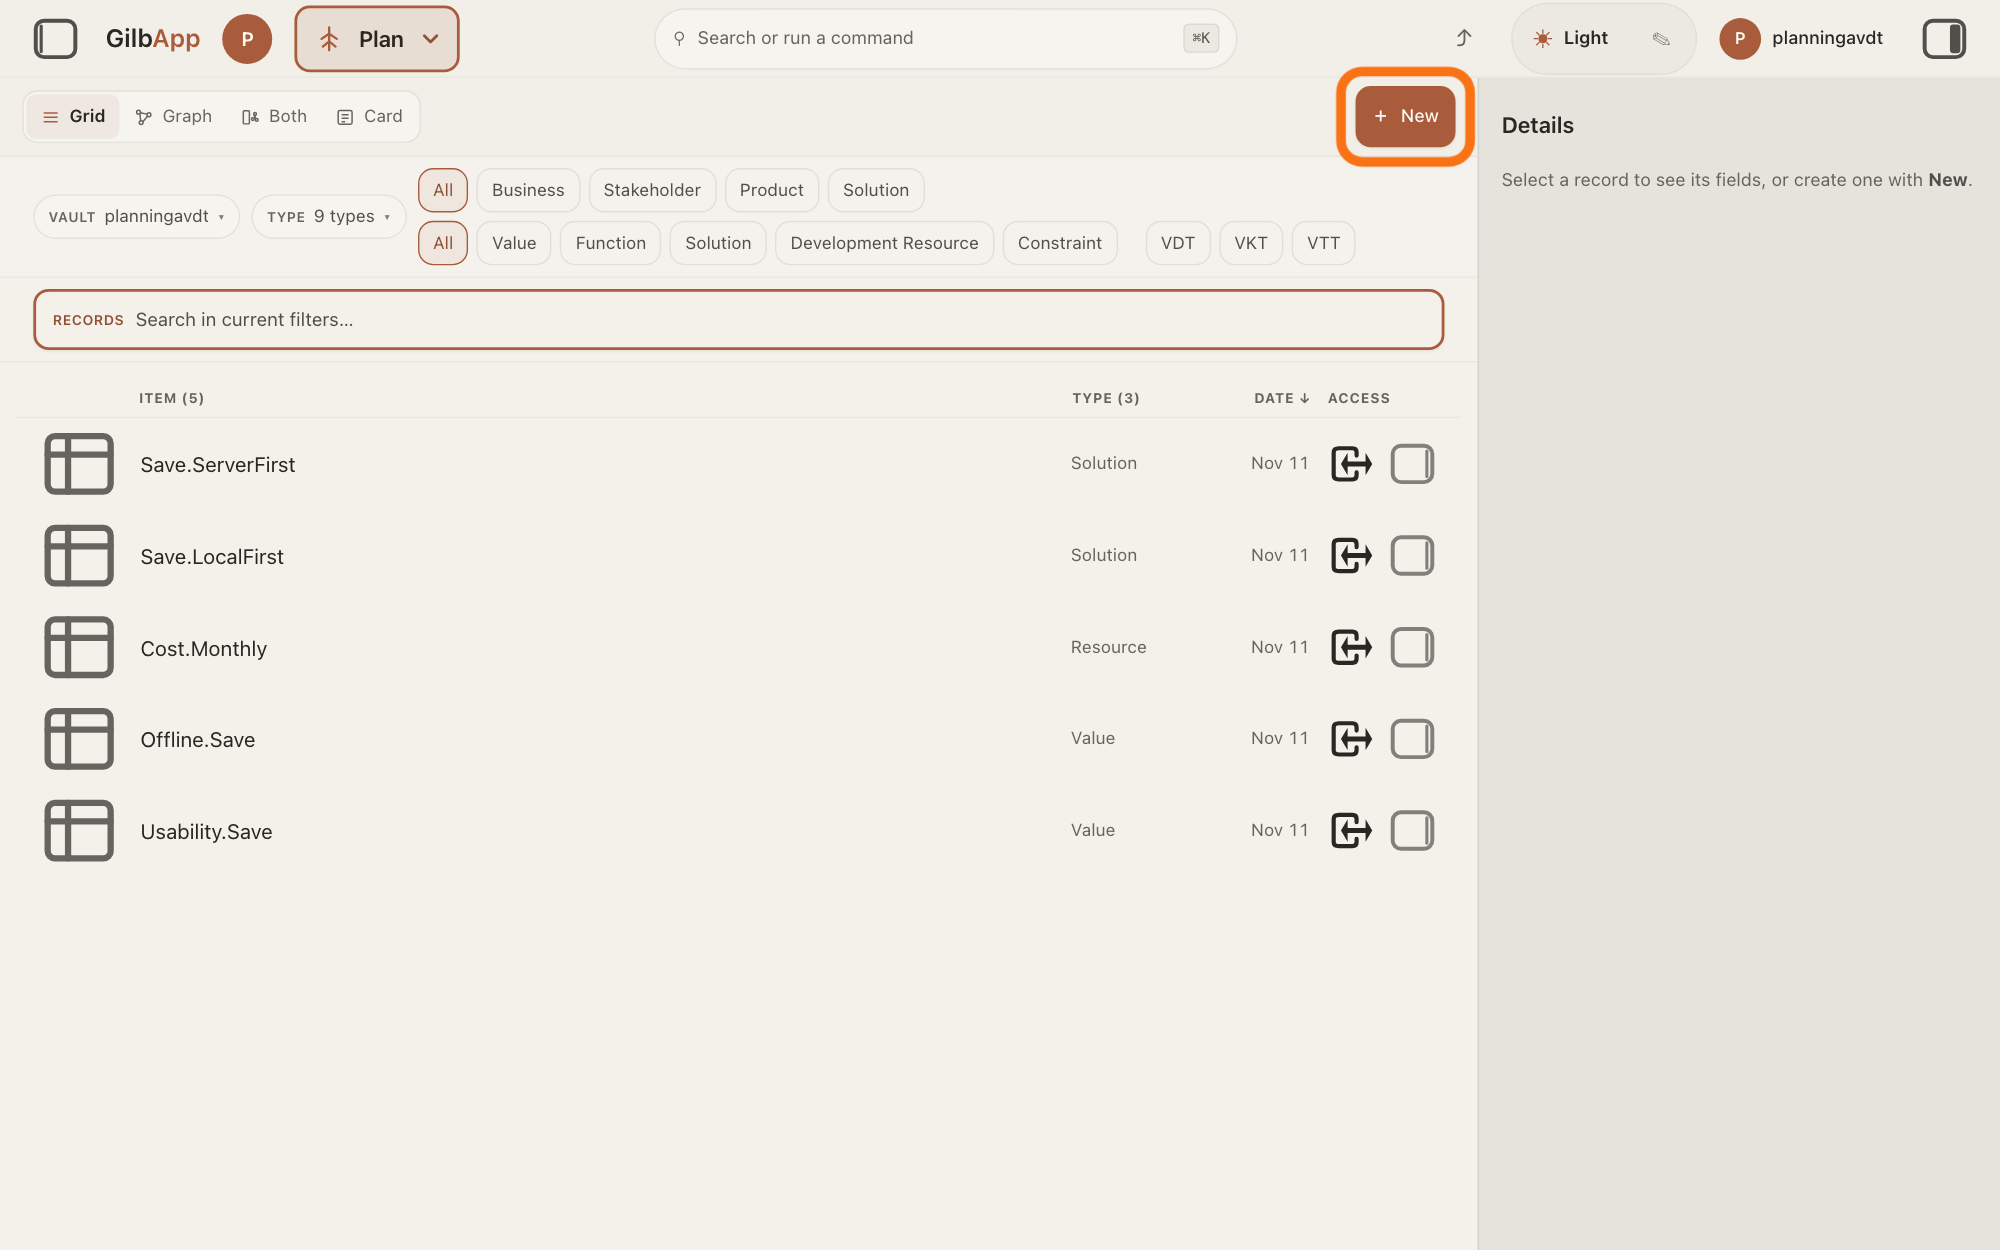
Press + New.
Press + New at the top right of the Plan screen. With no record selected, the type dialog opens at once.
Show as text
The "Plan" screen lists your Values, the Development Resource and the Solutions, with none selected; "VAULT" names your vault. Press the outlined "+ New" button at the top right.
More about this
If a record is selected, New first offers five choices: Create a record and link it to the selected record, Link the selected record to a record that already exists, Create a record on its own, Create a virtual folder and Upload a file. Choose Create a record on its own. A new Value Decision Table needs nothing else; the others make a record joined to the selected one, link two records that already exist, make a virtual folder or upload a file. In Plan, the GO TO panel also has New plan record, which does the same.
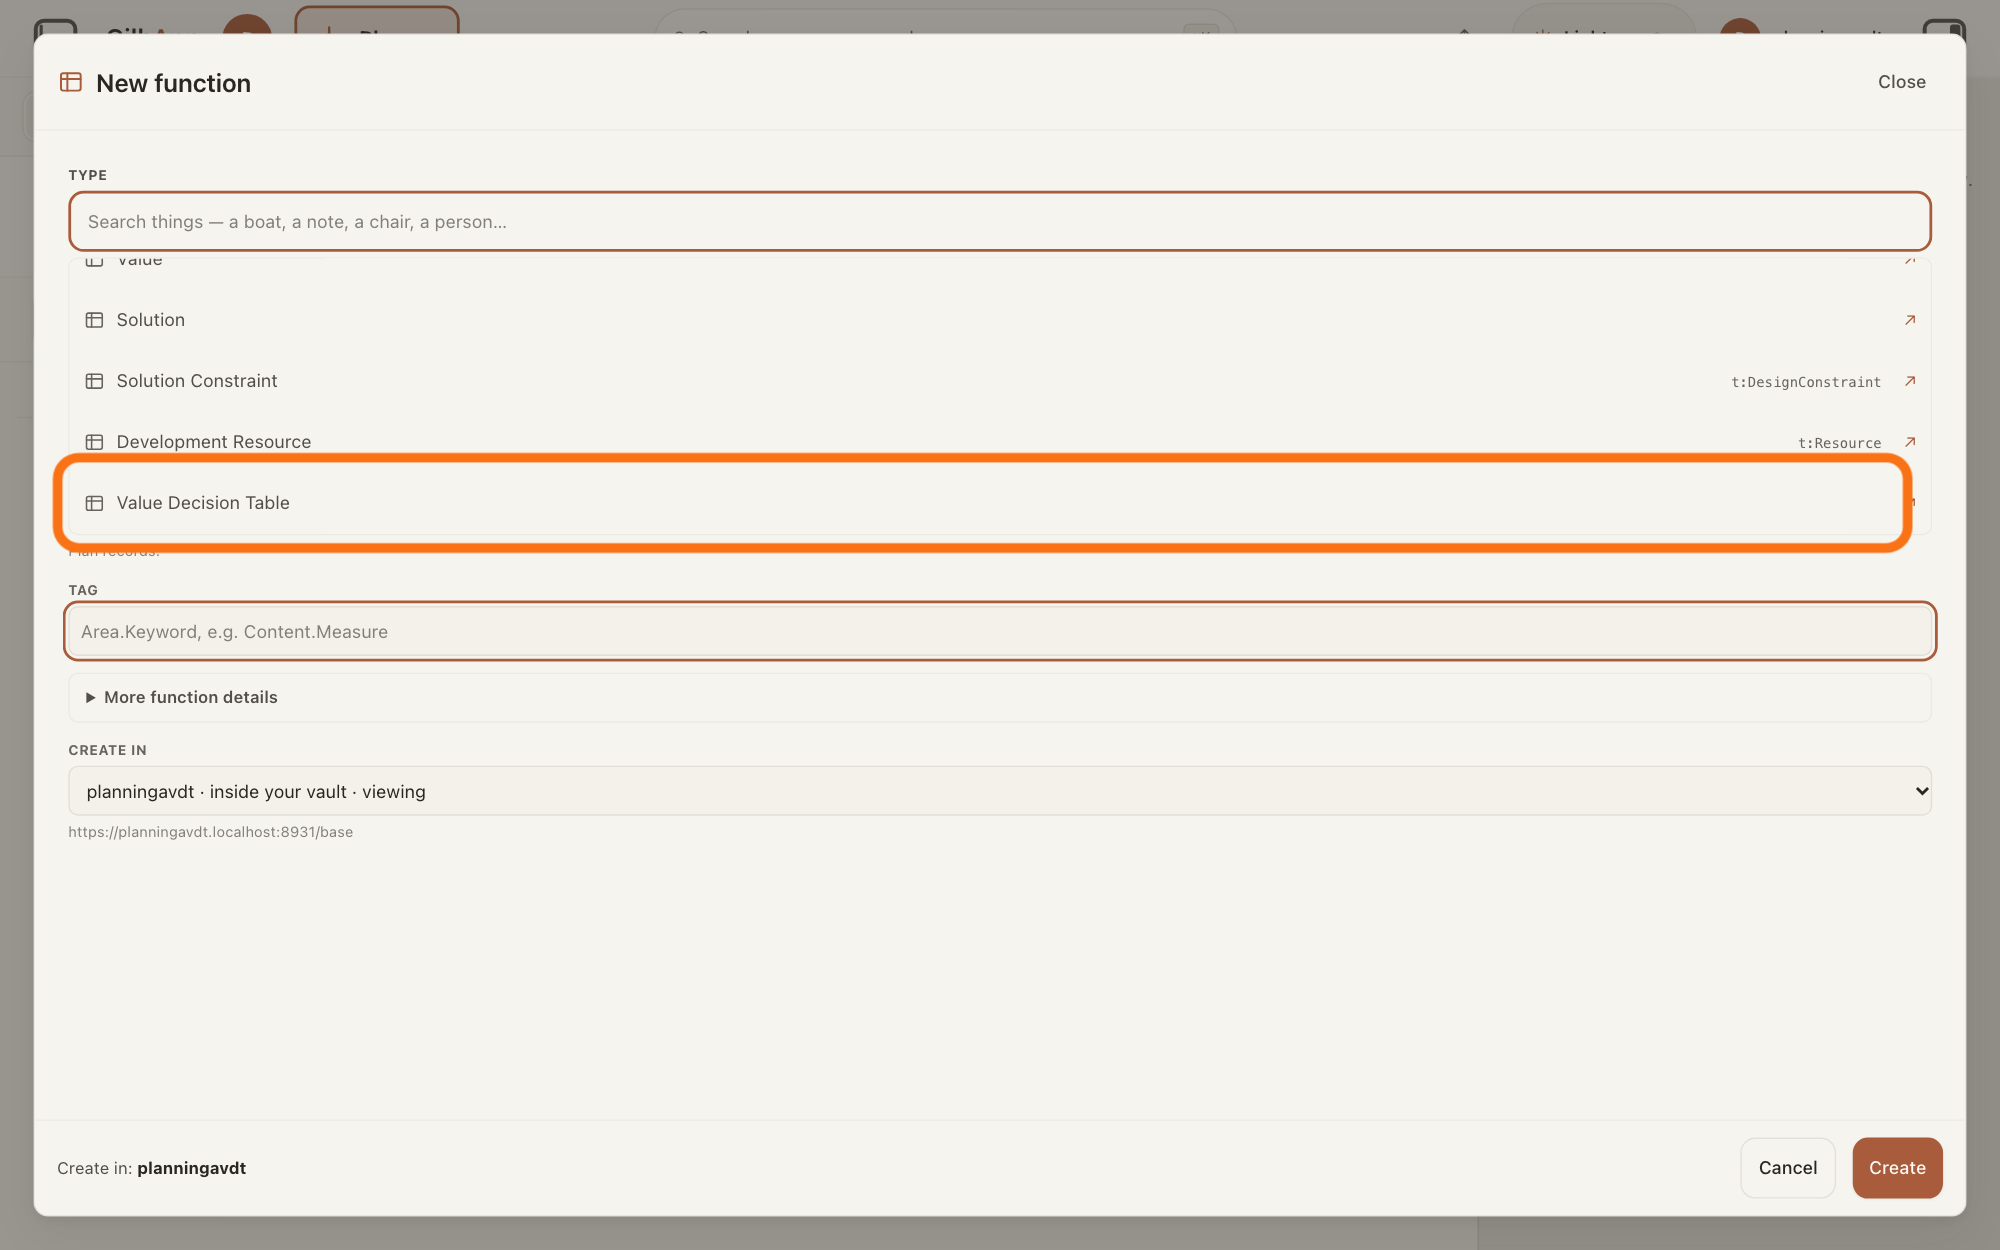
Under TYPE, choose Value Decision Table.
In the list under TYPE, choose Value Decision Table, near the end. A Value Decision Table (VDT) is a table that ranks options by how much they move the level's Values for their cost.
Show as text
A window headed "New function" is open. Under "TYPE" the list shows the plan types; it is scrolled so "Value Decision Table" shows. Press the outlined option "Value Decision Table".
More about this
The dialog opens headed New function with Function chosen; after you choose Value Decision Table it is headed New value decision table. The chosen type then shows under TYPE with a DEFINITION read from GilbVeda, the shared list of terms; it can be long, and you need not read it. × beside the type brings the list back. Value Kick-out Table, just below, picks one of several options; the answer on choosing between options with a VKT covers it. A search box above the TYPE list narrows it as you type, and Close at the top of the dialog closes it like Cancel; you need neither. ↗ at the end of a row shows what GilbVeda says about that type; you do not need it. Cancel closes the dialog without making anything. Where it shows Back instead, Back returns you to the five choices.
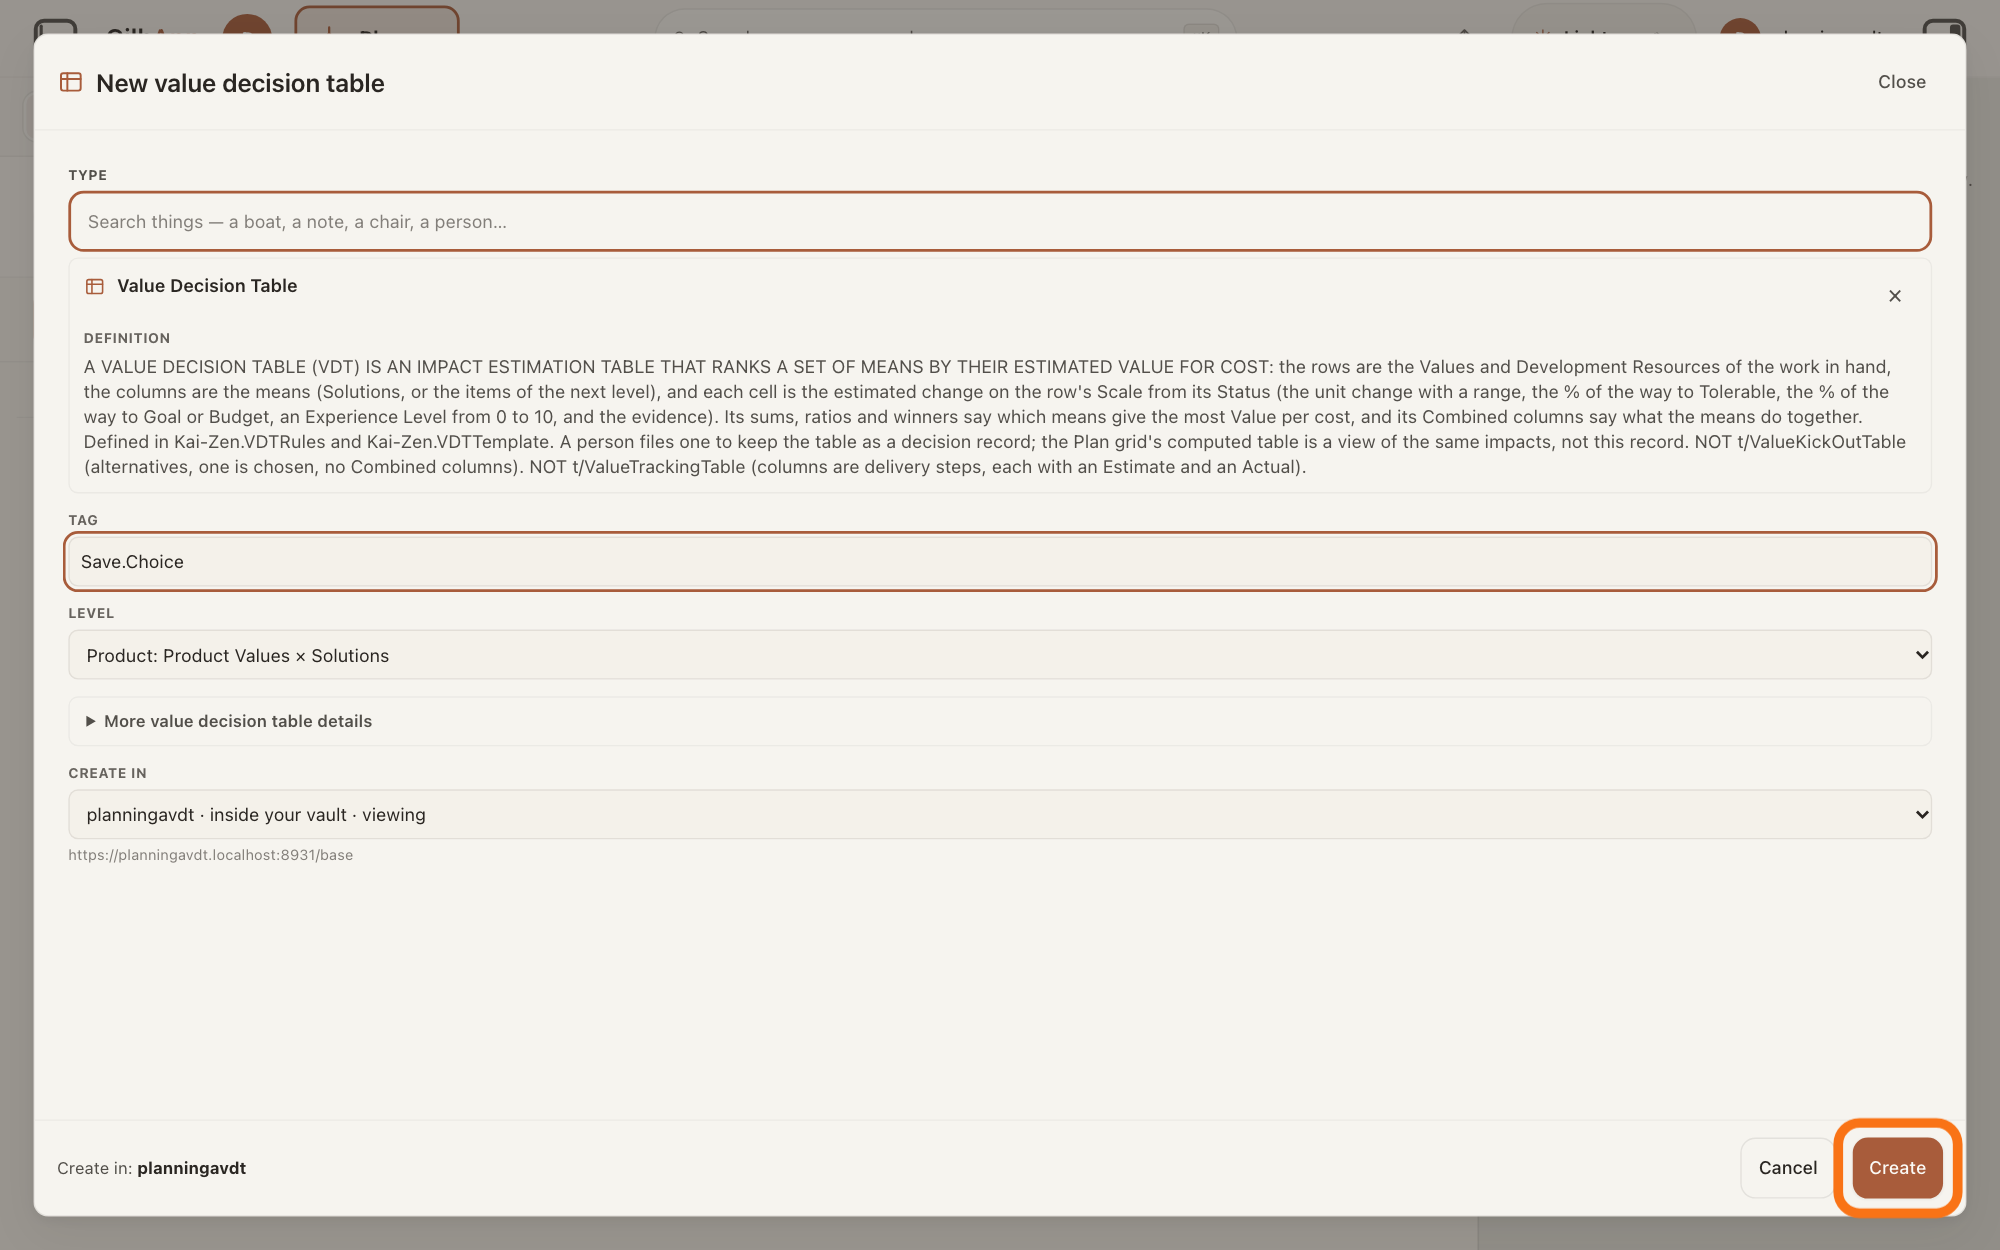
Type a tag in TAG and press Create.
Type a tag in TAG, keep Product: Product Values × Solutions under LEVEL, check CREATE IN, and press Create. A tag is the short name of a plan record: an area, a dot and a keyword, such as Save.Choice.
Show as text
The window is now headed "New value decision table". "TAG" holds a made-up tag, and "LEVEL" shows "Product: Product Values × Solutions". Press the outlined "Create" button at the bottom right.
More about this
LEVEL opens on Product: Product Values down, Solutions across; it cannot be changed after Create. The box shows Area.Keyword, e.g. Product.Decision until you type. With the tag empty the screen says Give it a Tag first: a Plan card is named by its Tag. Under CREATE IN, choose the vault where it will live; vaults you can only read say read only, you cannot create there. If the tag is already used in that vault, the screen says is already used in this vault. Pick another. If the vault is not the one you are viewing, the dialog stays open and says the record was made there, not in the vault you are viewing. It is not drawn here., with an Open it button. More value decision table details holds an optional Title and Description; you need neither.
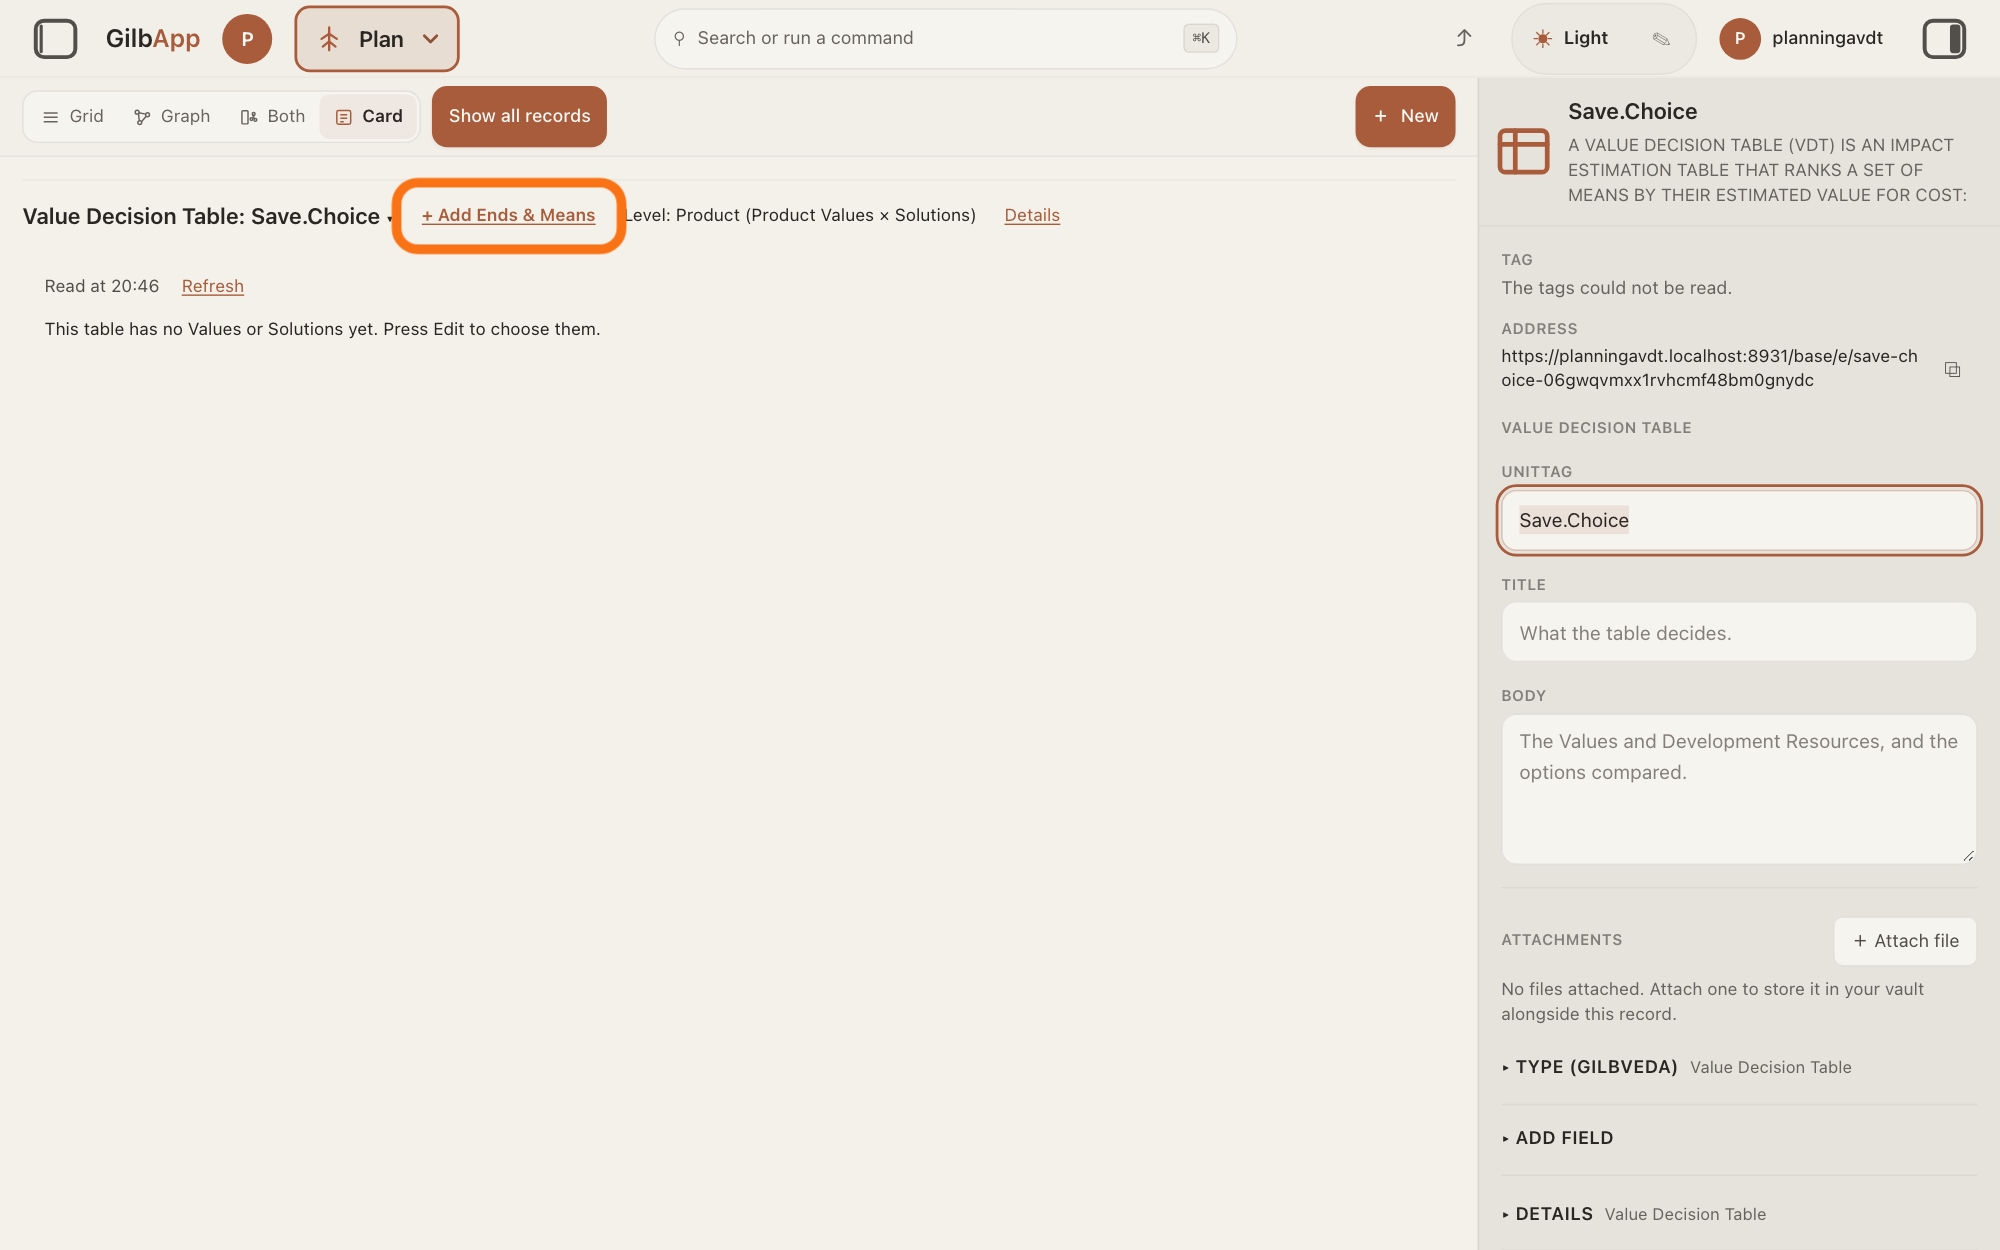
Press + Add Ends & Means.
At the top of the new table, press + Add Ends & Means: the ends are the Values and Development Resources the Solutions are judged by, and the means are the Solutions. The button then reads Done.
Show as text
The new table opens in the middle of the screen, headed "Value Decision Table:" and its tag. It says "This table has no Values or Solutions yet." Press the outlined "+ Add Ends & Means" right of the heading.
More about this
After Create, the table opens in the middle of the screen; if it shows in the right pane instead, press Open the table there. Its top line shows Value Decision Table: and its tag, + Add Ends & Means, Level: Product (Product Values × Solutions) and Details, which shows the table's own details in the right pane. Pressing the tag lists every Value Decision, Kick-out and Tracking Table in the vault; choose one to open it. Until you choose rows and columns, the table says This table has no Values or Solutions yet. Press Edit to choose them.; the button it means is + Add Ends & Means. Only a person who may write the table sees that button.
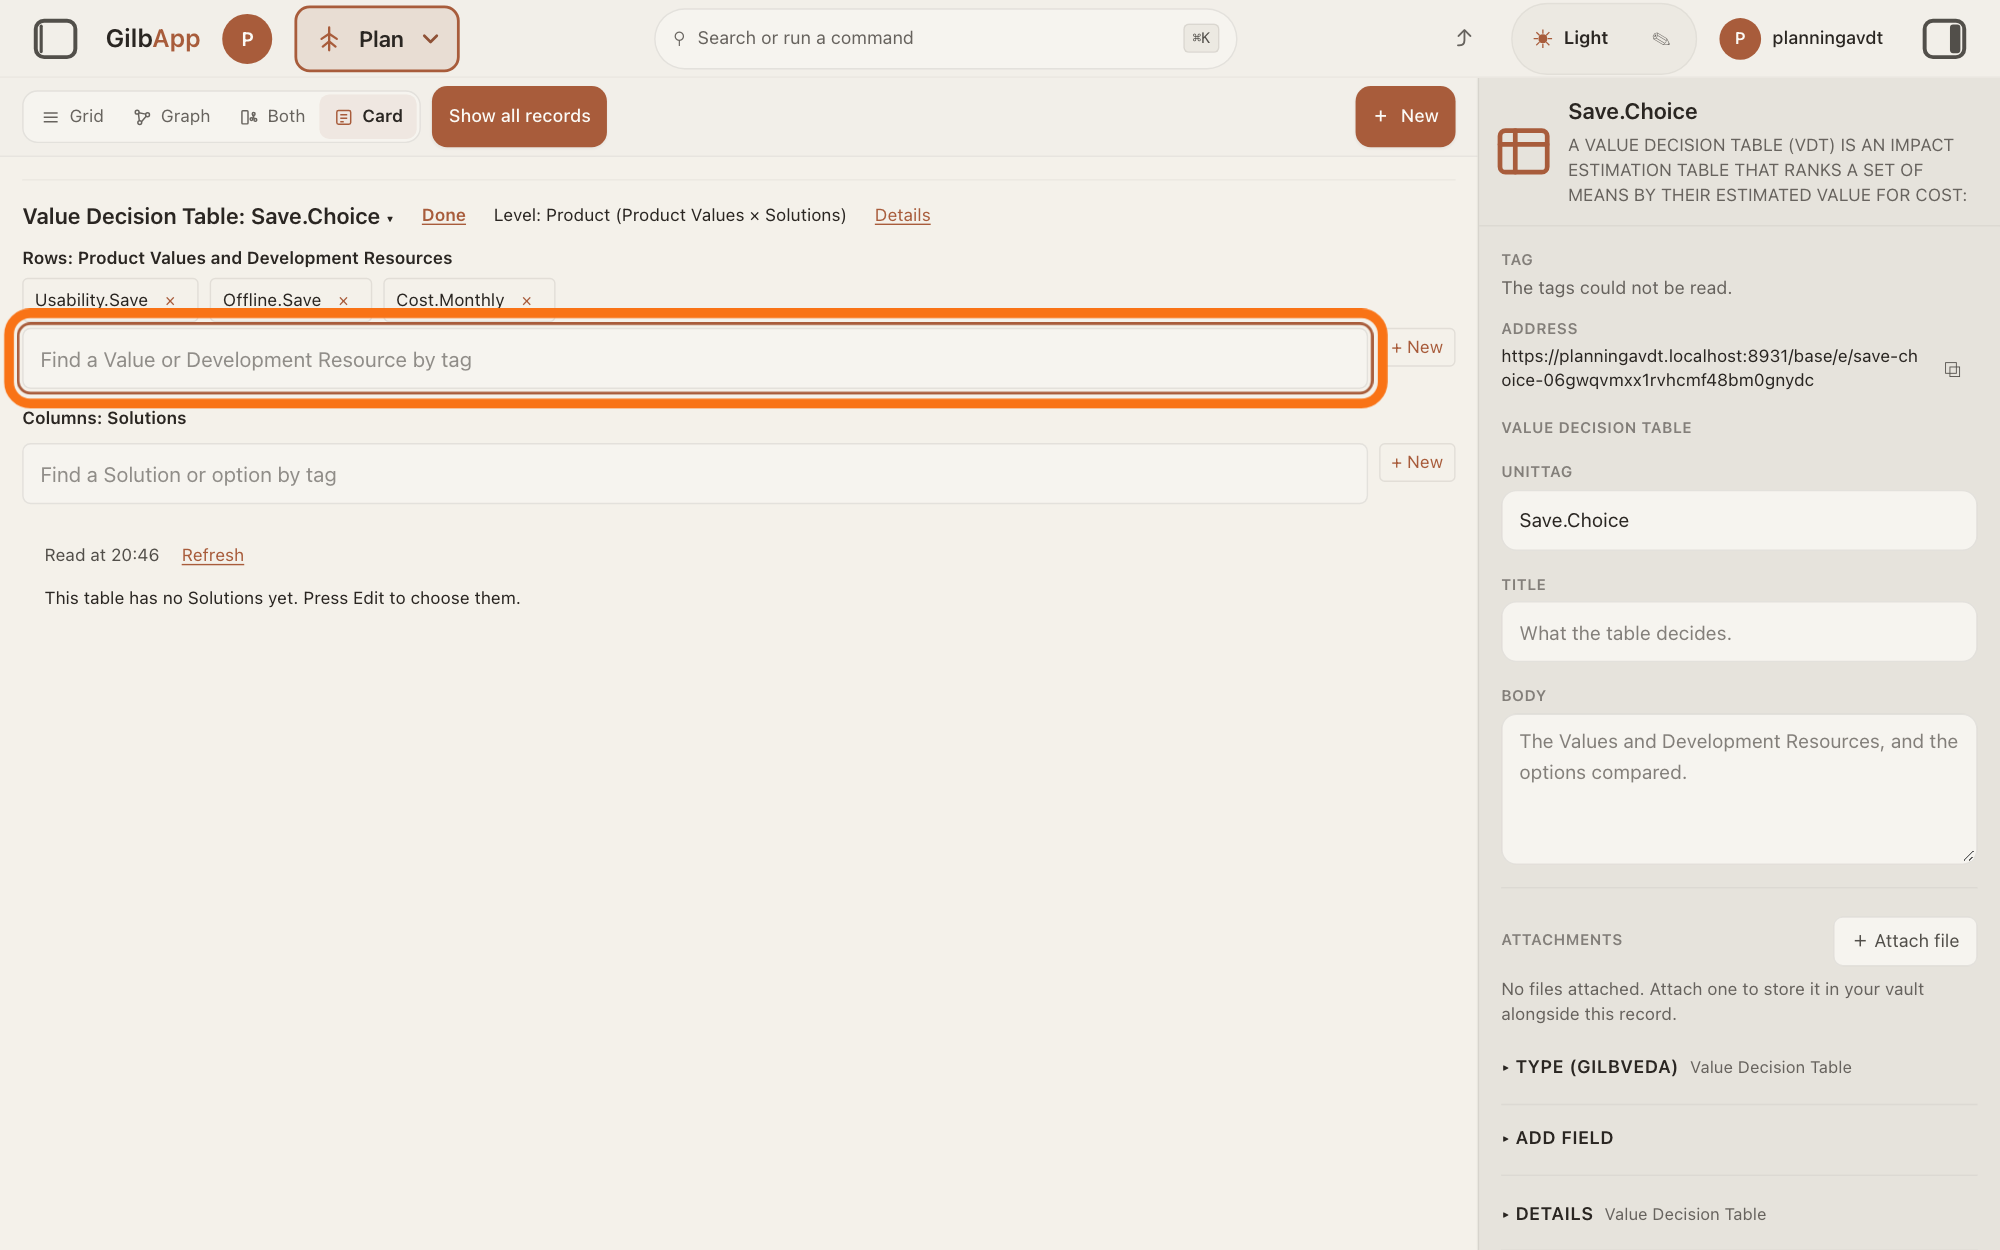
Under Rows: Product Values and Development Resources, search and select the Values and Resources.
Type part of a tag in the box that shows Find a Value or Development Resource by tag and select it, once for each Value the Solutions should move and each Development Resource they use. A Value is a perceived benefit, measured as a number; a Development Resource is what the work uses up, such as money or time.
Show as text
The row picker is open under "Rows: Product Values and Development Resources", with three chips chosen: Usability.Save, Offline.Save and Cost.Monthly. The outlined box "Find a Value or Development Resource by tag" is empty again; type a tag in it and choose the match to add a row.
More about this
Each one you choose becomes a row and shows above the box with a ×, which takes it out of the table, not out of the vault. Only Values at the table's level, Product, are offered (a Value that shows Product because no level was chosen counts there too), and Development Resources of any level. + New beside the box makes a new card instead: it opens a box that shows Tag, e.g. Usability.Learn, holding what you typed, with New Value (Product), New Development Resource and Cancel. Without a Development Resource, the ratios end in no cost yet.
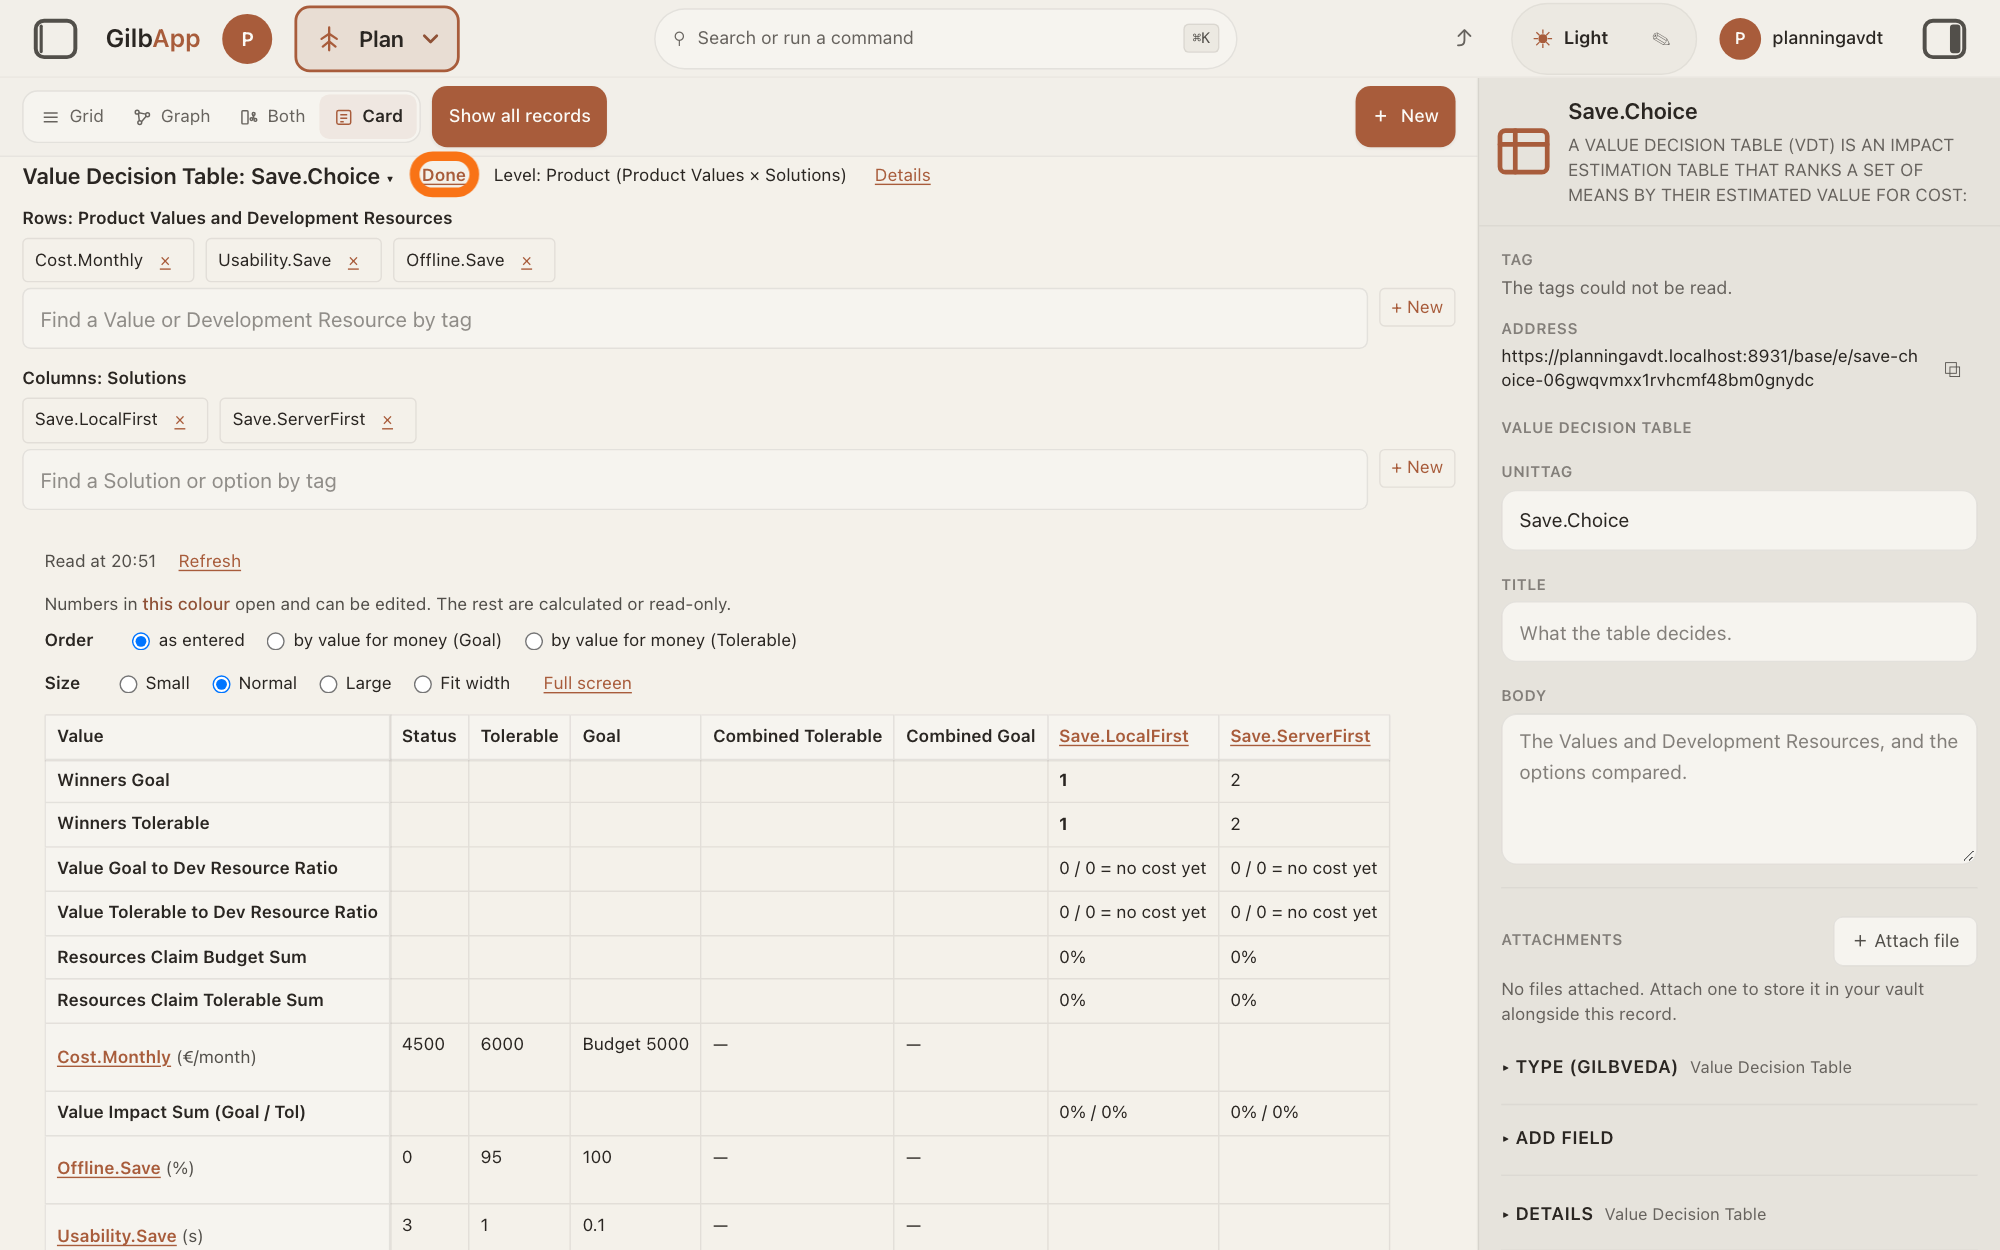
Under Columns: Solutions, search and select each Solution, and press Done.
Type part of a Solution's tag in the box that shows Find a Solution or option by tag and select it, once for each Solution to compare; then press Done. A Solution is how a Function (what a system does) gets done.
Show as text
Under "Columns: Solutions" the chips Save.LocalFirst and Save.ServerFirst are chosen, and the table is drawn below. Press the outlined "Done" right of the heading "Value Decision Table:" to close the pickers.
More about this
Each Solution becomes a column, even before it has an impact; a Solution Constraint (a Solution a named person requires) is offered too. + New beside the box makes a new Solution from the tag typed in it. × beside a chosen one takes it out of the table only. The table then shows, for each row, its Status (where it stands now), Tolerable (the survival limit) and Goal (the number you plan to reach; Budget for a Resource), Combined Tolerable and Combined Goal (what all the Solutions do together), and a column per Solution, with the rows of sums and Winners on top (Deeper, below the steps, reads them). Above it, Order, Size (Small, Normal, Large, Fit width) and Full screen change only how it is shown, and Refresh reads the vault again.
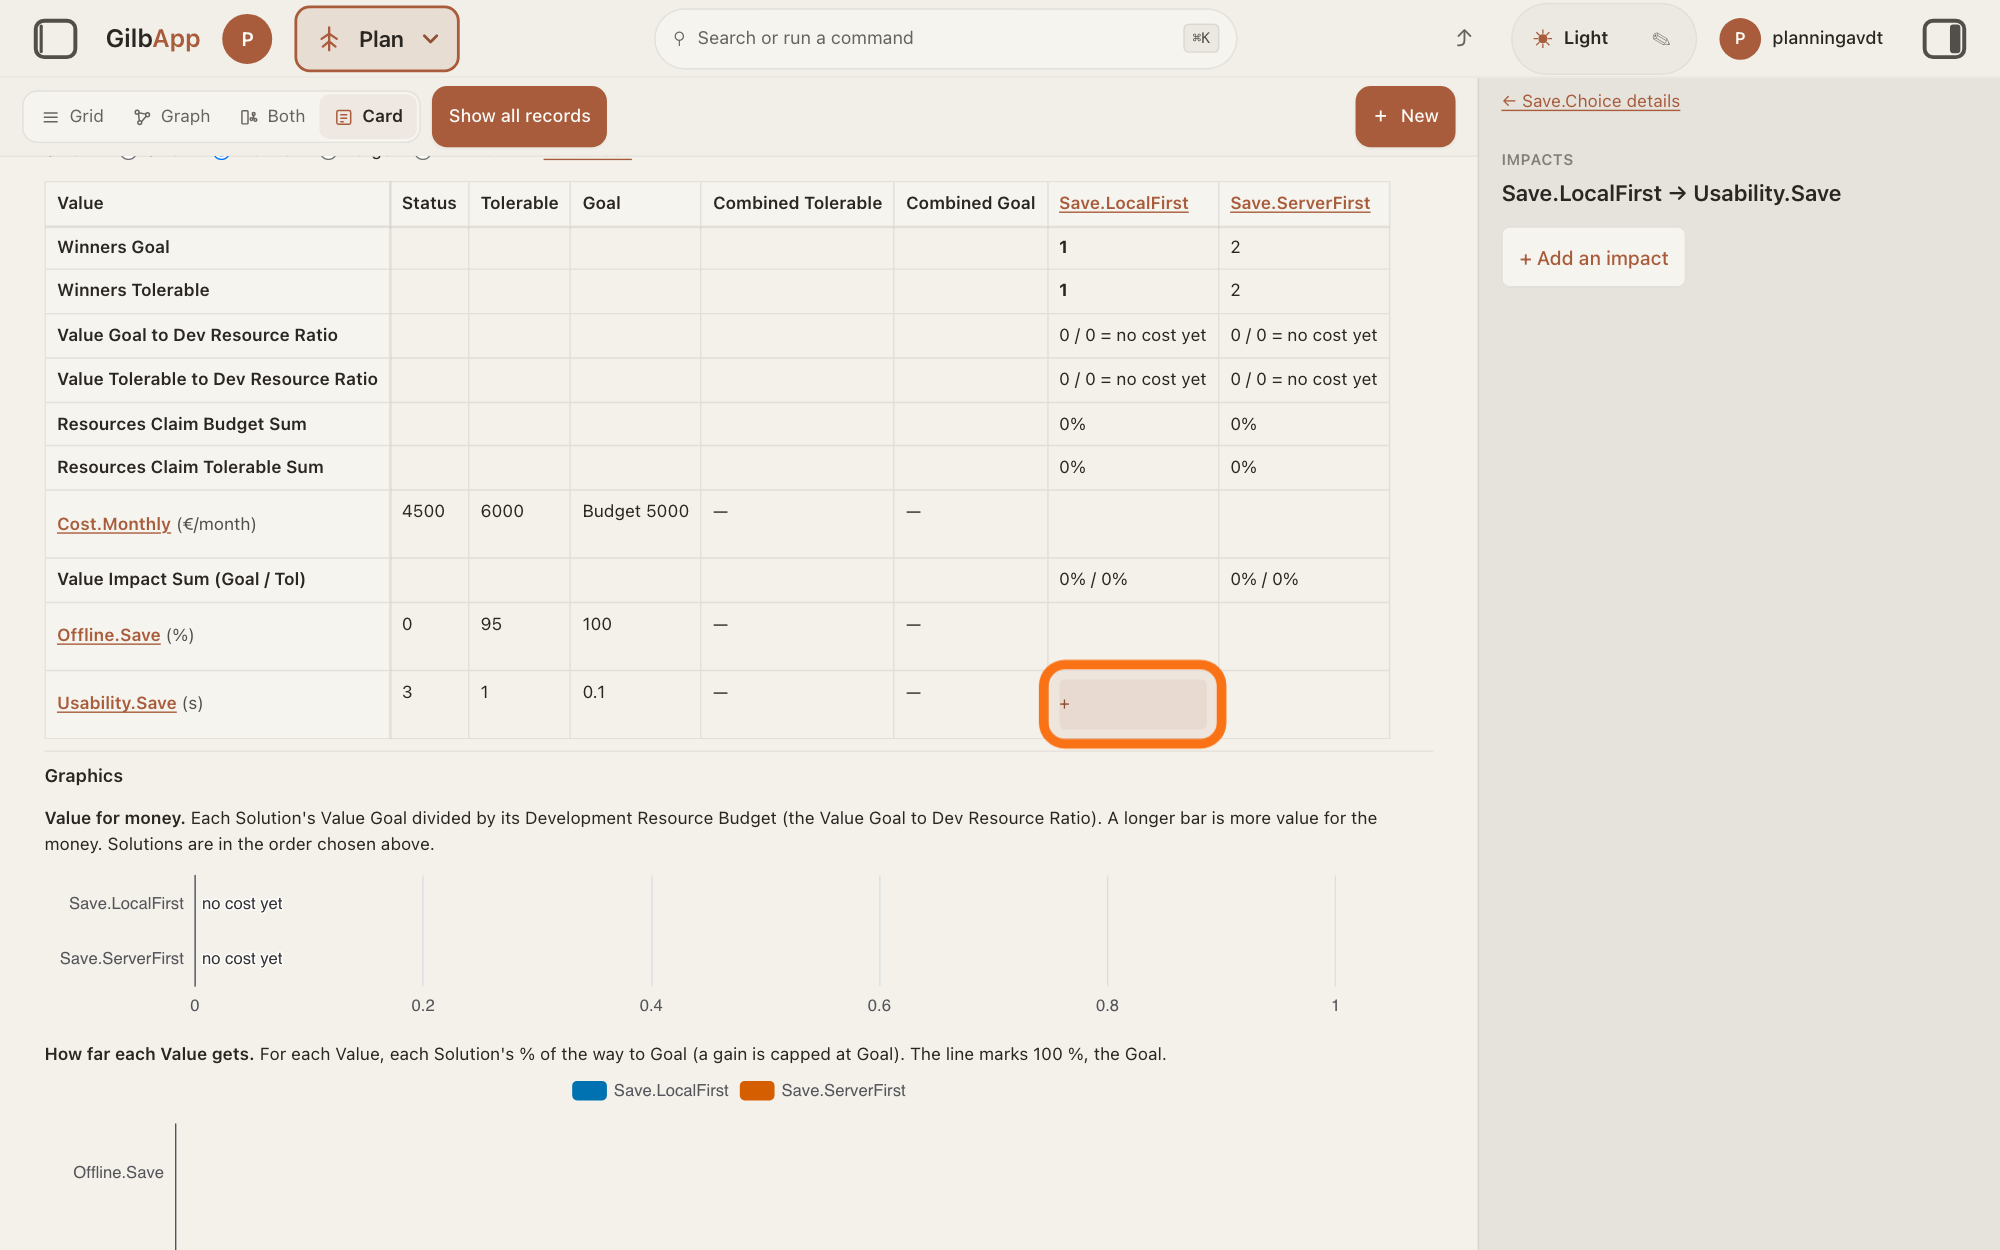
Press the cell where a Solution meets a Value.
Press the cell in a Solution's column and a Value's row. The right pane opens under IMPACTS, headed by the Solution's tag, → and the Value's tag.
Show as text
The pickers are closed and the table shows the columns Save.LocalFirst and Save.ServerFirst. The outlined cell is where Save.LocalFirst meets Usability.Save; it is empty and shows a small "+". Press it.
More about this
An empty cell shows + when you point at it. An impact, the effect a Solution has on a Value or a Development Resource, fills its cell by itself once written on the Solution's card: the change, then Tol and Goal with a % (how much of the way from Status to Tolerable, and to Goal, that Solution alone goes; a Resource's cell shows Tol and Bud, toward its Tolerable and Budget), EL (the Experience Level) with its number, and the evidence. With no Tolerable or Goal on the Value, the cell says No % yet. The line above the table says "Numbers in this colour open and can be edited. The rest are calculated or read-only.", or You can open every number to read it. None can be edited here. A Solution, Value or Resource name in the table opens its card in the right pane instead.
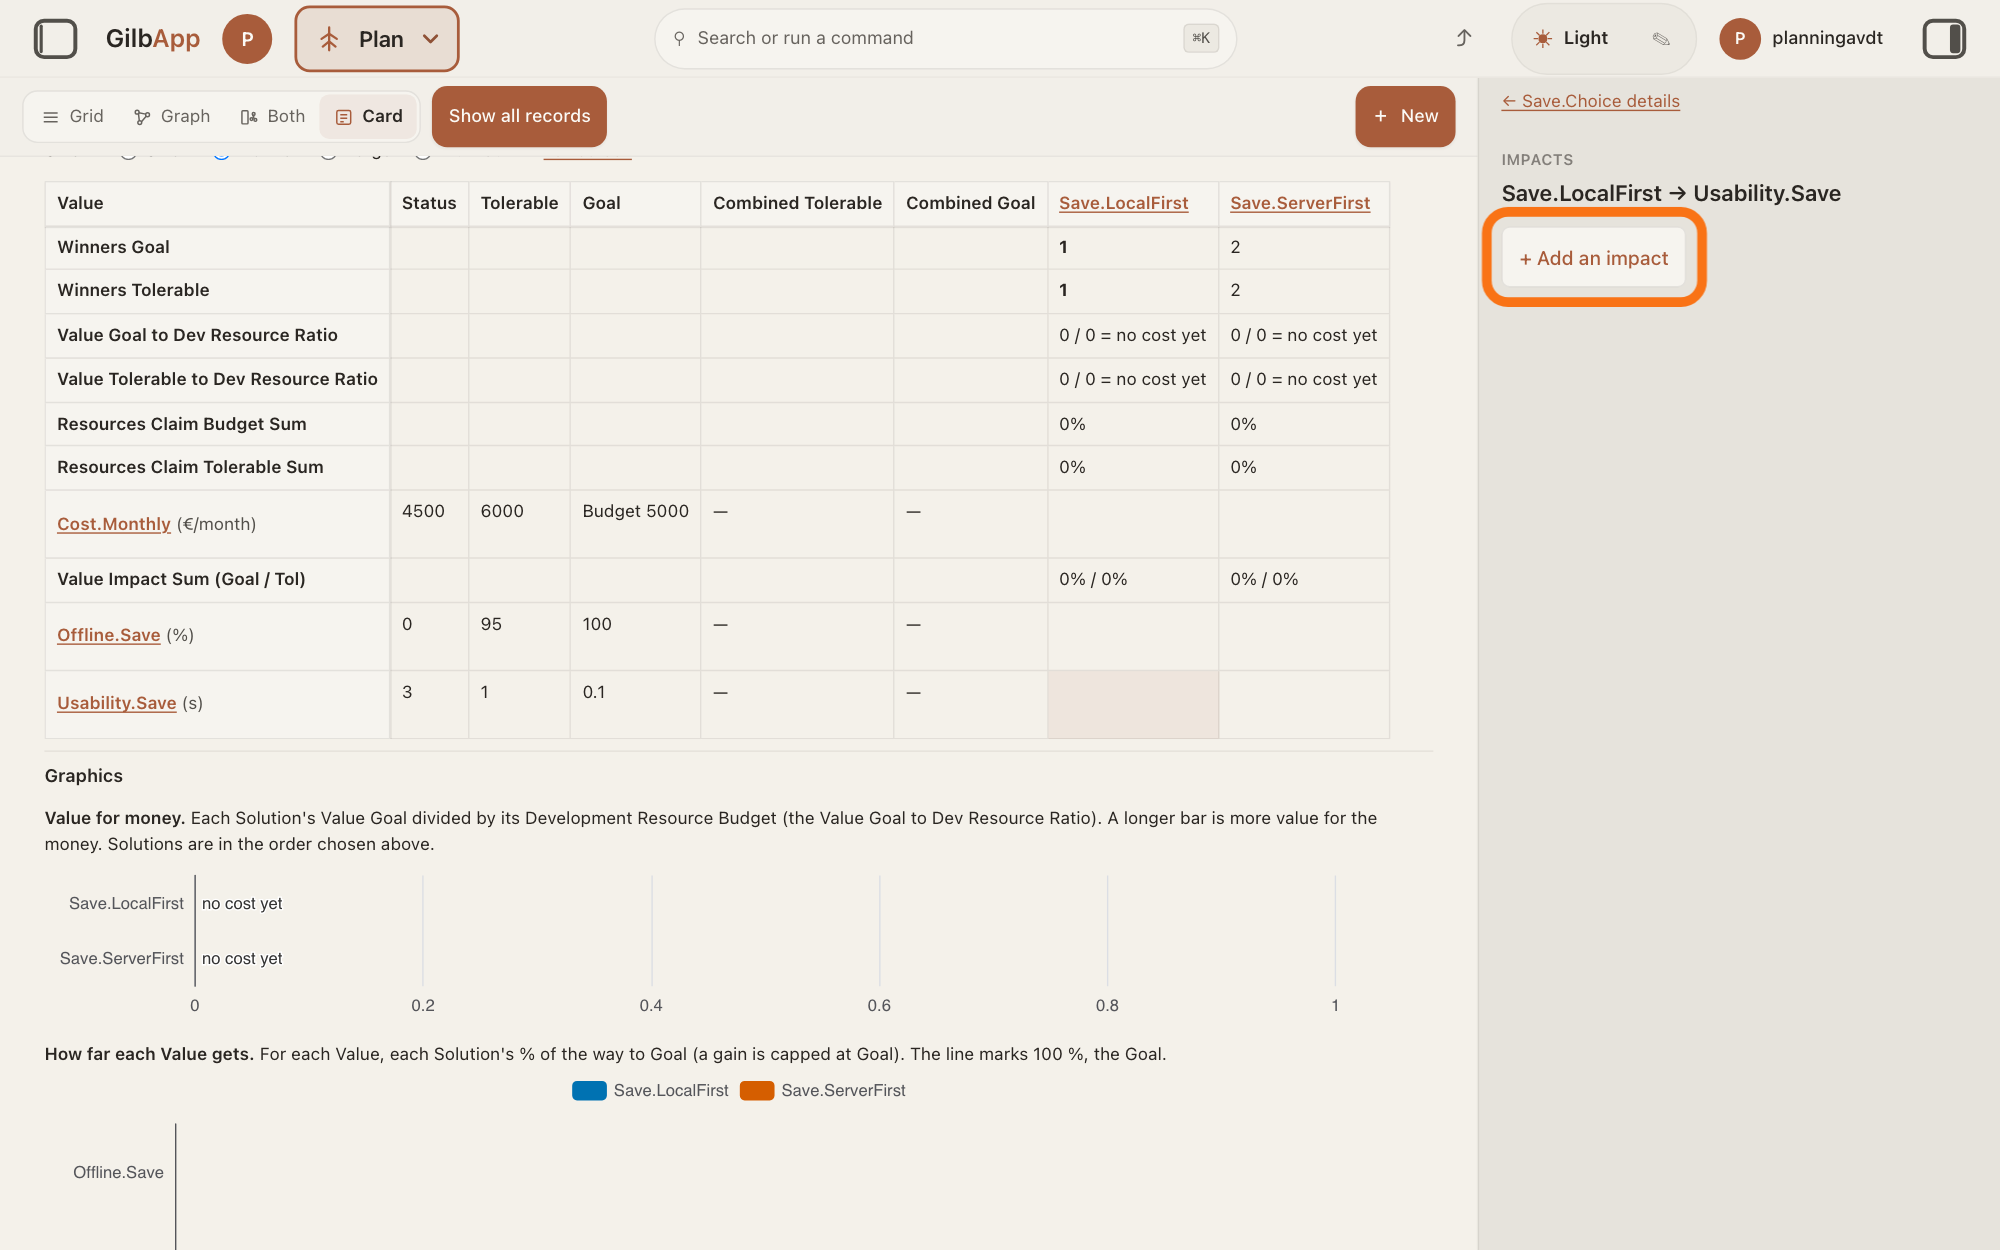
Press + Add an impact, type the change and press Enter.
In the right pane, press + Add an impact, type the change the Solution brings, such as -2.8 or +100, and press Enter (for a Resource, the amount it uses). You type the change, not the end number: -2.8 on a Status of 3 makes 0.2.
Show as text
The right pane shows "IMPACTS" and the title "Save.LocalFirst → Usability.Save". Press the outlined "+ Add an impact" button under the title, type the change and press Enter.
More about this
The impact then shows in the cell, and on the Solution's card under Impacts. The unit comes from the Value's Scale, the ruler it is measured on. If you leave the box with nothing typed, no impact is made; text that is not a number gets Enter a decimal number. The Value needs one number under Status first; the answer on writing a Solution in your plan shows what the screen says when it has none. + Add an impact shows only on a cell with no impact yet, to a person who may write the Solution.
Under HOW SURE, choose the Experience Level.
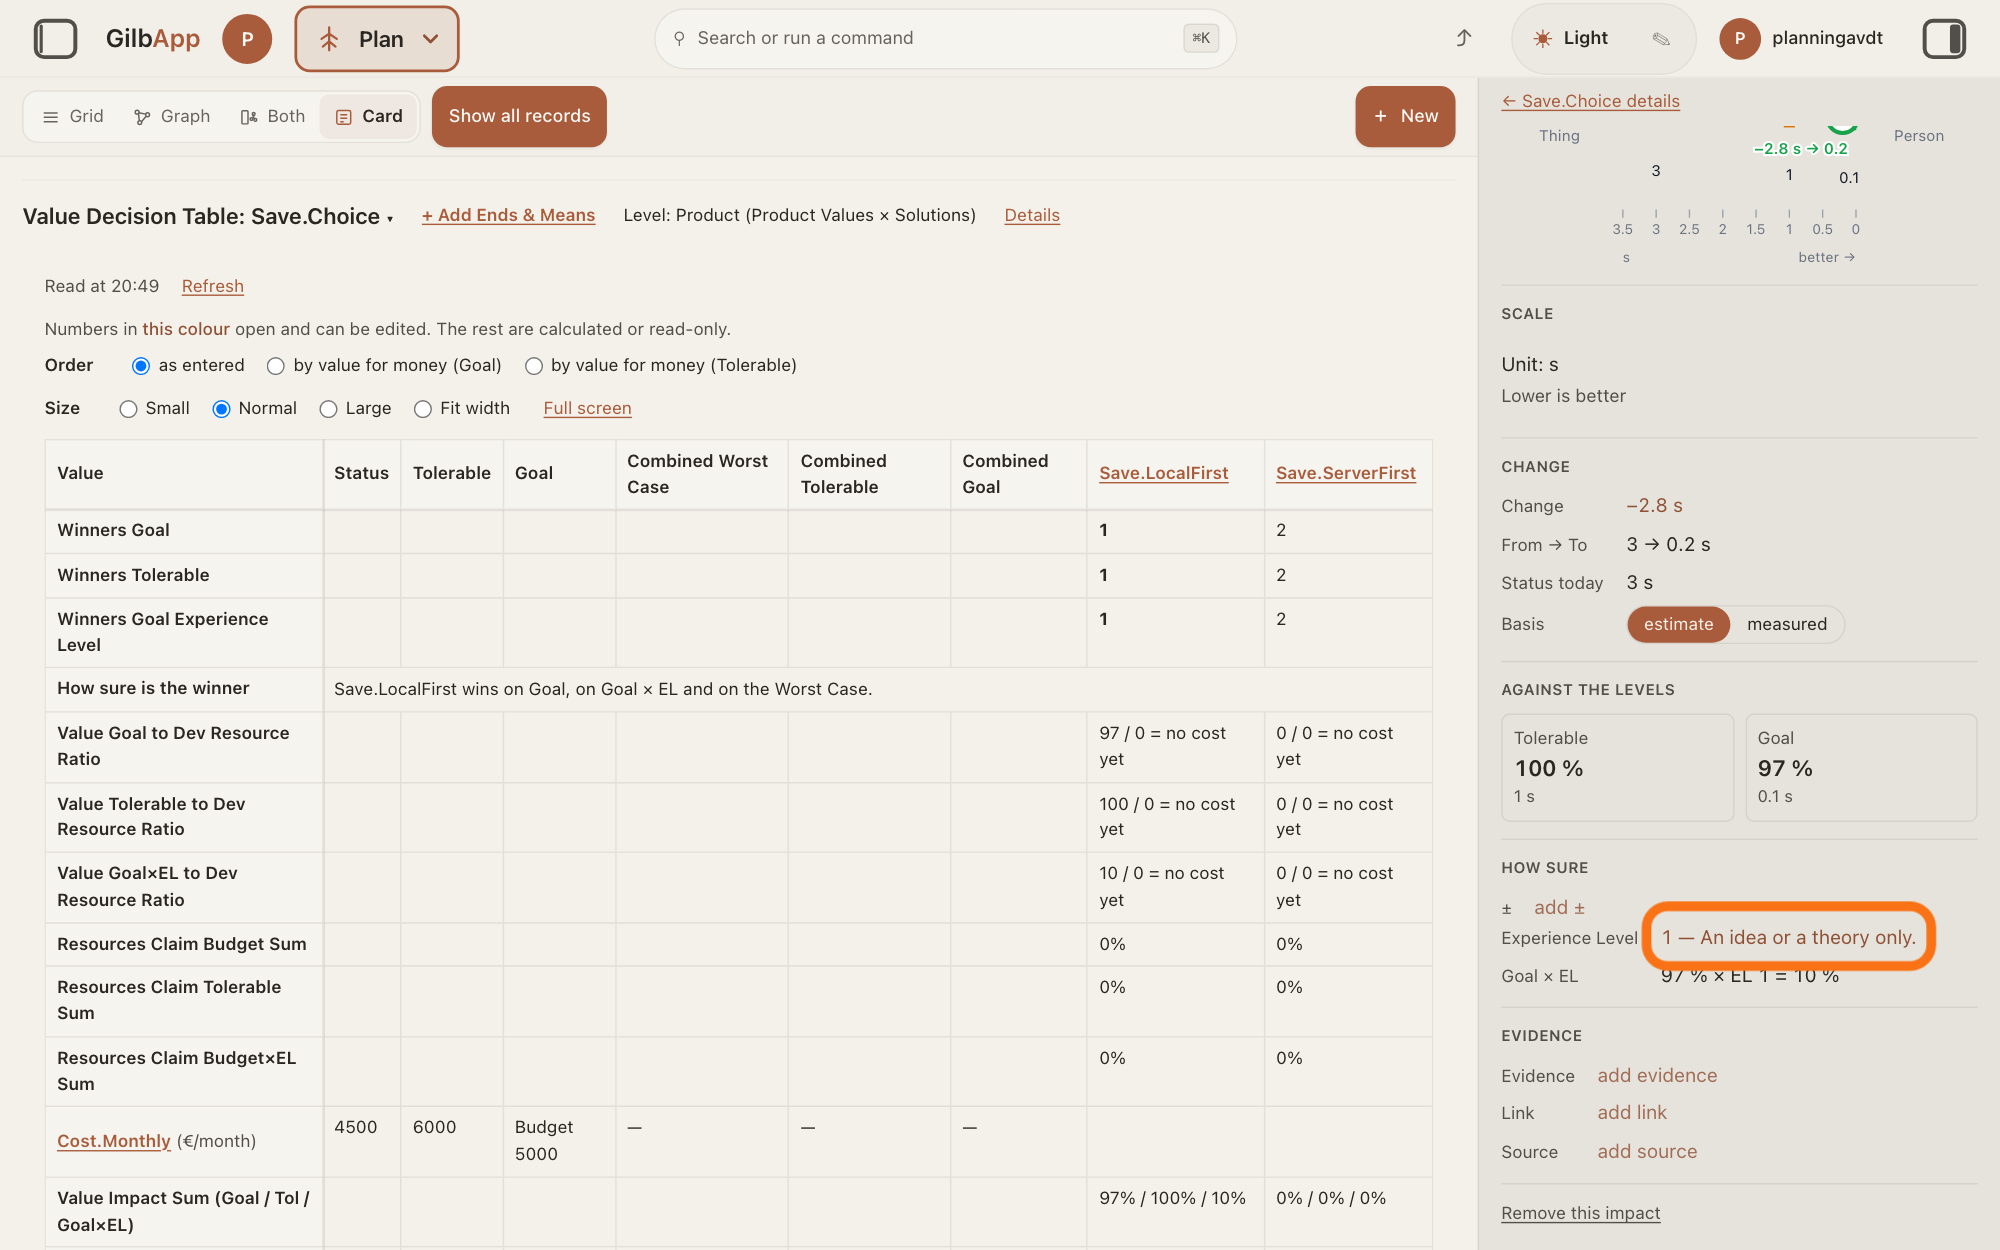
Under HOW SURE, press the Experience Level line, which shows 1 — An idea or a theory only. until you choose, and choose a level from 0 — We can't point to any experience. to "10 — We did exactly this before, in a very similar situation. We will get this result." It says how much experience stands behind the number.
Show as text
The right pane shows the new impact: "CHANGE" reads −2.8 s, then "AGAINST THE LEVELS" and "HOW SURE". Under "HOW SURE", the outlined value of "Experience Level" reads "1 — An idea or a theory only." Press it to choose how sure the estimate is.
More about this
The line Goal × EL under it shows the Goal % weighted by the level: low experience counts against the Solution. Beside ±, add ± takes a range, how far off the number may be, such as 0.3, and then adds a Best and a Worst line. Under EVIDENCE, add evidence takes the facts and reasoning, and add link a link to them. All three are optional. The pane also shows the change under CHANGE, the Value's levels under AGAINST THE LEVELS and Remove this impact at its foot; you need none of them. Repeat steps 8 to 10 for each cell you want to fill.
Deeper
Also asked:
How do I choose between several ideas? Write each idea as a Solution and set them side by side in a Value Decision Table: it ranks them by how much Value each gives for its cost, and in Winners Goal the best is 1, in bold.
Each Solution's column adds up its cells. Value Impact Sum (Goal / Tol / Goal×EL) adds the Values' % of the way to Goal, to Tolerable, and the Goal % weighted by the Experience Level; Resources Claim Budget Sum, Resources Claim Tolerable Sum and Resources Claim Budget×EL Sum add the same for the Development Resources. The three ratio rows divide the one by the other, such as Value Goal to Dev Resource Ratio: how much Value the Solution gives for its cost. Winners Goal, Winners Tolerable and Winners Goal Experience Level rank the Solutions by those three ratios; 1, in bold, is the best. When two print the same ratio, a line under the row says they tie.
Combined Tolerable and Combined Goal add up each row across all the Solutions: how far they take that Value together. Combined Worst Case, shown once there is an impact, uses the worse end of each range toward Goal, then the Experience Level. Every % is a whole number: the table shows the direction, not precision.
With two or more Solutions, How sure is the winner says in one sentence whether the Goal winner also wins on Goal × EL and on the Worst Case; that line is GilbApp's own. Under the table, Graphics draws Value for money and How far each Value gets, and Best set lists the Solutions to take first by Kai's rule: Tolerable first, then Goal, within Budget, with Budget used:, Still below Tolerable after the set:, Reached Goal: and, when any, Left out: and why. Order can put the columns by value for money (Goal) or by value for money (Tolerable) instead of as entered.
When Kai-Zen builds a Value Decision Table, it estimates each cell by asking: if this Solution is built as specified, how far does it move the Value from its Status toward its Goal? It writes each impact as the change on the Value's Scale, such as 5 to 2 minutes is -3, with a ± range, an Experience Level and the evidence: a link, the reasoning, or both. It works out each % and never guesses it: % Tolerable is the change ÷ (Tolerable − Status), % Goal is the change ÷ (Goal − Status), with Budget in place of Goal for a Development Resource. GilbApp works out each % from the numbers on the cards; you do not type it.
In the Kai-Zen method, low experience always counts against an option: a gain is multiplied by the Experience Level ÷ 10, and a loss, or a Resource's cost, by 1 + (10 − the Experience Level) ÷ 10, so a cost at level 0 counts twice. GilbApp weighs the Goal × EL numbers the same way, and counts an impact with no level chosen at 1.
Kai-Zen then names the winner by each ratio and, if the three ratios pick different winners, says so and why. It builds the set: it adds Solutions, best ratio first, until every Value is past Tolerable, then toward Goal, with the cost kept within Budget, and names any Value the set cannot bring to Tolerable. It leaves out an option that breaks a constraint, something that must be done because a named person requires it. It keeps every number a person set, as the answer on what happens if the AI estimates a level you set explains, and counts each cost once, as the answer on writing a Resource and setting the project's currency explains. In a project, a VDT is not done until it is a table in the vault: Kai-Zen writes it there, reads it back and shows it in the approval at the end. Outside a project it shows it to you, and writes it to a folder or vault only if you ask.
Kai-Zen writes the levels of a plan from the top, and after each one a VDT picks what the next level holds; the VDT at Product picks the Solutions. So LEVEL also offers Business: Business Values × Stakeholder Values and Stakeholder: Stakeholder Values × Product Values: their columns are the Values of the level below, and the heading over the second box says so. At those levels, with no Development Resource row, the table has no ratios and no best set: a Value draws no development cost. The answer on the levels of a plan explains the levels.
In Plan, the GO TO panel also has Table (Open the plan table: Values against Solutions, every number calculated.): the same table for the whole plan, with every Solution that has an impact and every Value and Development Resource it changes, and Levels to choose the pair of levels shown. It needs no + Add Ends & Means.
A table card keeps which rows and columns it holds; each number lives on the impact, so it is the same on the Solution's card and in every table that holds both. GilbApp ranks the Solutions and works out the best set; it does not choose one for you, and it takes none out.
This answer is written for a computer screen.
Source: GilbApp af0f04ee838a4d55887d2ff1f72edd49a4ff7ca0 (https://gilb.com/app/version.json read 2026-11-09, buildTime 2026-11-09.522Z, dirty false); code read at af0f04ee (no checkout). Type list and table types: planKinds.ts:5-19 (Value Decision Table, Value Kick-out Table, Value Tracking Table); recordTypes.ts:270-291 (TABLE_LEVEL_OPTIONS, Level, option labels <Level>: <words>, required, default Product, fixed after create), :442-486 (New value decision table, tag placeholder Area.Keyword, e.g. Product.Decision, Title What the table decides., Description). Create dialog: ConnectedCreateDialog.tsx:319 (tag sentence), :1527-1545 (required field up front), :1887-1899 (More ... details), :2474-2478 (label uppercase). After Create: NewRecordButton.tsx:106 openRecordFromList; recordsView.ts:76-84 (Grid becomes Card); RecordDetail.tsx:366-370, :2209-2210 (table in the main pane, Open the table in the right pane); TableCard.tsx:630-700 (heading <kind>: , tag switcher, + Add Ends & Means/Done, Level: ..., Details), :100-118 (Rows: <Level> Values and Development Resources, Columns: Solutions), :192-243 (chips, ×), :226-245 (picker Find a Value or Development Resource by tag, Find a Solution or option by tag), :601-616 (+ New choices New Value (<Level>), New Development Resource, New Solution); PlanPickerNew.tsx:41-104 (+ New, Tag, e.g. Usability.Learn, Cancel); planLevelPair.ts:132-141 (rows: Values at the upper level, Resources any level; columns: Solutions and Solution Constraints), :153-155; TableSwitcher.tsx:1-10. Table: PlanTable.tsx:1051-1053 (... Press Edit to choose them.), :779-905 (heads and rows), :947-962 (key line), :921-944 (Order, Size), :1869-1871 (Full screen), :1784-1787 (Refresh), :418-516 (cell button, + on hover, lines), :1926-1927 (Graphics, Best set); planTable.ts:263-350 (cell lines Tol, Goal, Bud, EL), :368-512 (sums, ratios, winners, Combined, hasEl), :568-572 (order labels), :190-192 (tie line); columnSum.ts:167 (no cost yet); planSure.ts:36-89; bestSet.ts:382-419; planCharts.ts:95, :145. Impacts pane: PlanImpactsPane.tsx:163-205 (Impacts, <Solution> → <Value>); PlanImpacts.tsx:1912-1945 (+ Add an impact only with no impact and edit rights); PlanImpactEstimate.tsx:520-680 (How sure, ± add ±, Best/Worst, Experience Level, Goal × EL, Evidence, add evidence, add link), :433-466 (level list); planEstimate.ts:20-46 (eleven levels, default 1); planImpacts.ts:714, :809-813. GO TO panel Table: gilbAppMenuRows.ts:176-177. Standards (2026-11-09): Kai-Zen.VDT (Template, Rules, Question, Analyse, Solutions, Show), Kai-Zen.VDTRules (Unit, Percent, Experience, ExperienceWeight, Evidence, Sums, Ratio, Winners, Combined, Round, Set, CountOnce, Shared, HumanSet, Constraints, Remaining), Kai-Zen.VDTTemplate (Blank, Example: Save.LocalFirst, Save.ServerFirst, Usability.Save, Cost.Monthly), Kai-Zen.ExperienceLevels (0 to 10), Agent.VDT (Role, Choices), Kai-Zen.ConstraintRules.Options. GilbVeda public read: t:ValueDecisionTable, t:ValueKickOutTable, t:ExperienceLevel, t:Impact, t:ImpactEstimationTable. cross-references by title. Resource row and cell words planTable.ts:228-240 (Budget <n> under the one Goal heading, PlanTable.tsx:832; the row was already said by the shared Budget for a Resource), :296-300 (Tol <n>% · Bud <n>%), :333 (Tol <n>% · Goal <n>%); valuePercent.ts:163-177.
Checked against GilbApp d529620.