
← Stakeholders, Plan, Standards and Ontology on screen
How do I read the plan as a graph?
Short answer
Press Main menu, choose Plan, press Graph, press a level and a kind, and press + on a card to open its parts.
Before you start
You need to be signed in to GilbApp on a computer. You also need plan records in your vault, some of them linked, and the Functions at the level Product; the answers on writing a Function in your plan and on writing a Function in parts and linking them show how. The pictures show a made-up person on a test site; your screen shows your own name and address.
Words used here (5)
- GilbApp
- GilbApp is the app, opened in a web browser at https://gilb.com/app, where you open, fill and share your vaults.
- record
- A record is one piece of data with its own address, such as a person, a place, a thing or a note.
- Kai-Zen
- Kai-Zen is the planning agent: it finds out what you want, chooses the way, hands the work to other agents and reports back.
- relation
- A relation is a named link between two records, such as part-of or connected-to, that says how they are related.
- project
- A project is work to bring about a change you want, such as a new app or a better way of doing something.
Steps
Press Main menu at the top left and choose Plan.
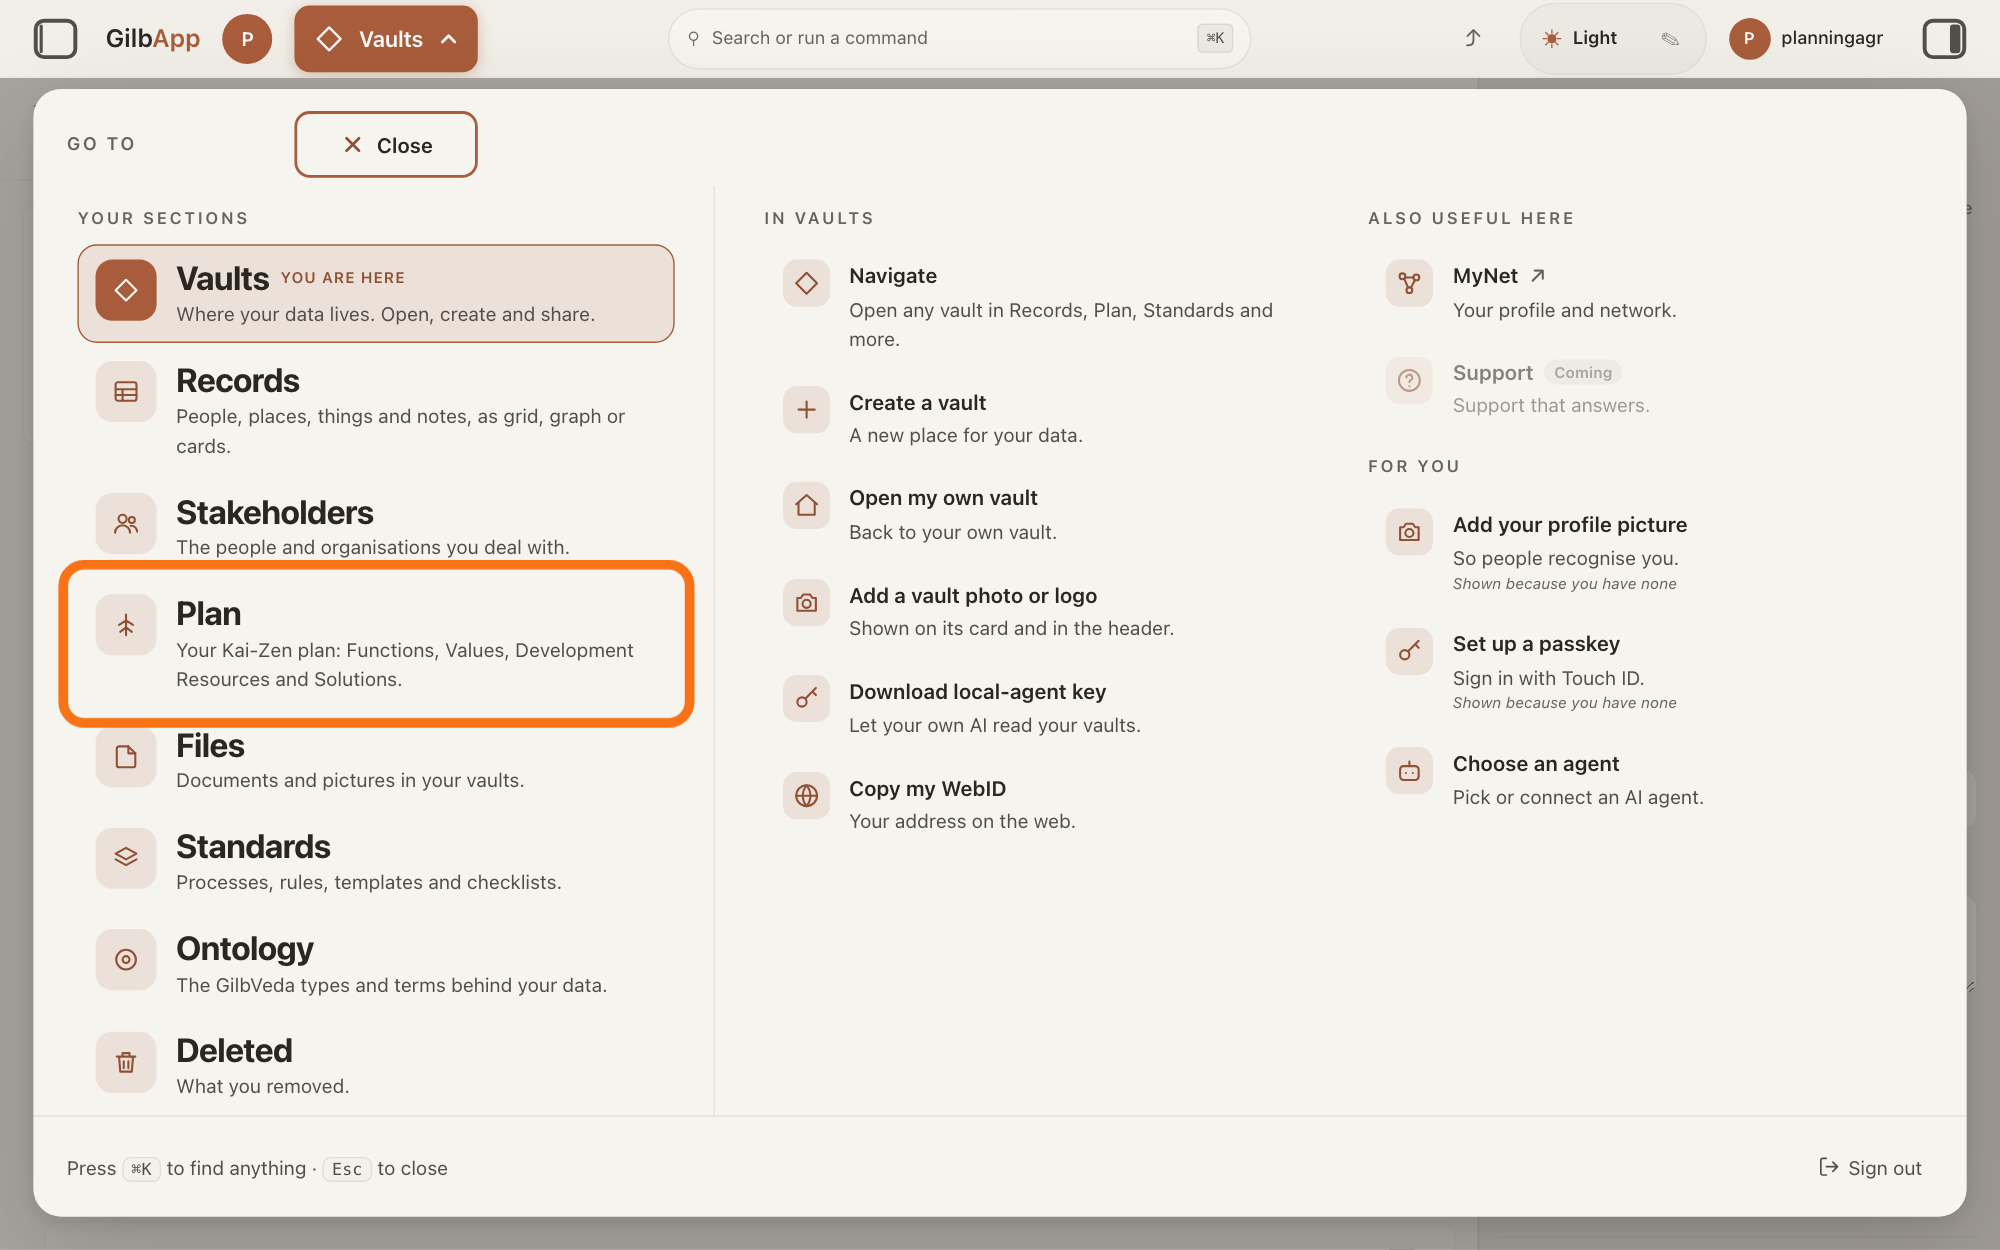
Press Main menu, next to your profile picture at the top left, and under YOUR SECTIONS choose Plan. The button shows the name of the section you are in, such as Vaults.
Show as text
The "GO TO" panel is open over the screen. Look in the left column under "YOUR SECTIONS": the outlined row is "Plan", with the line "Your Kai-Zen plan: Functions, Values, Development Resources and Solutions." Press it to open the Plan screen.
More about this
A panel headed GO TO opens; Plan reads Your Kai-Zen plan: Functions, Values, Development Resources and Solutions. You can also press the Plan button on the card of a vault (the place where a person or a group keeps their records) in Vaults. The Plan screen lists your plan records and has the views Grid, Graph, Both and Card.
Press Graph.
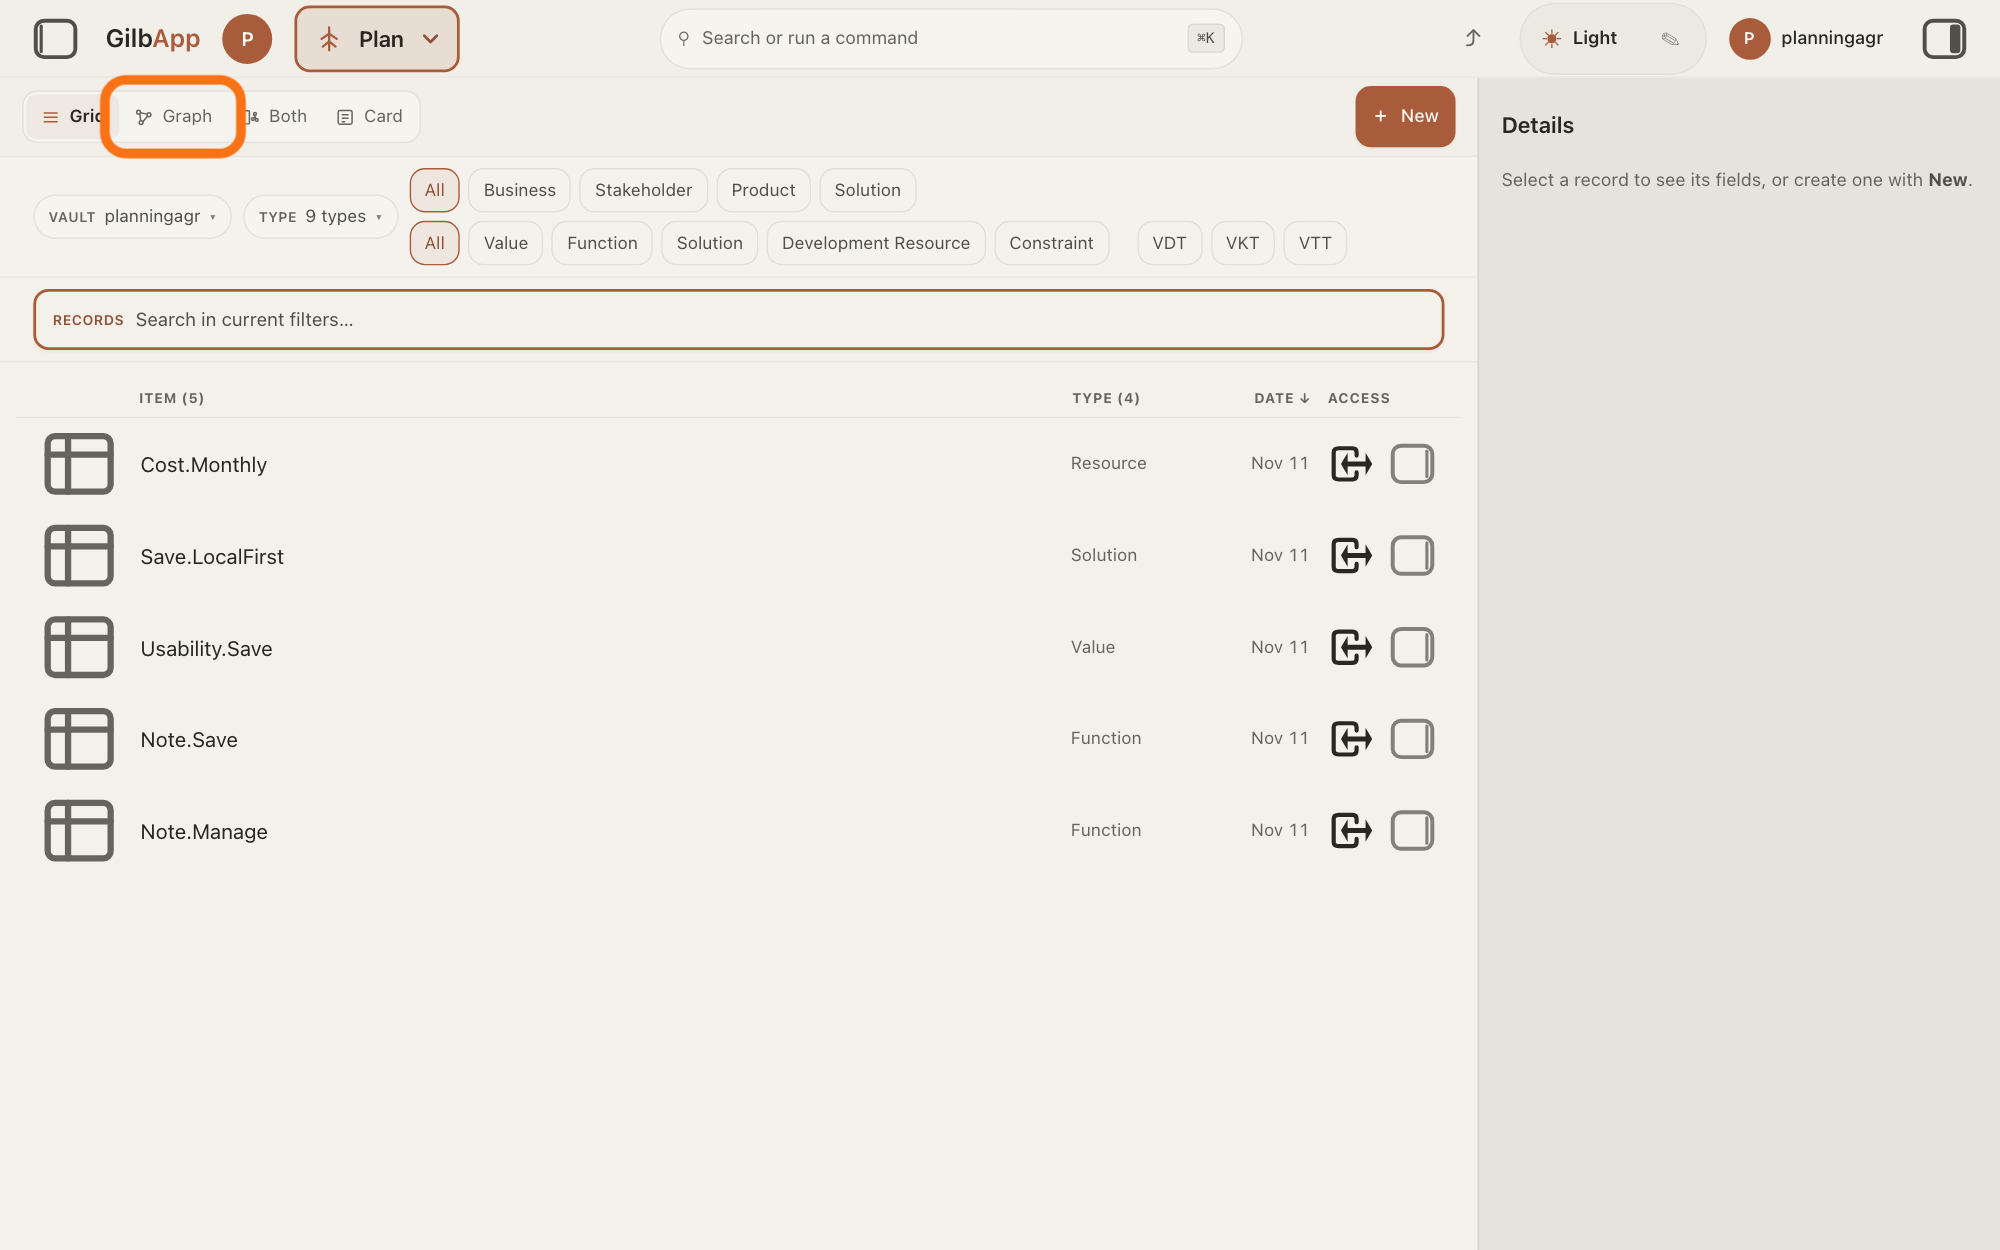
Press Graph in the row of views above the list. The graph draws the same plan records the list shows, each as a card with its name and type, and each line between two cards is a link, named by its relation.
Show as text
The "Plan" screen lists five plan records in "Grid" view. At the top left, the outlined button "Graph" is in the row of views with "Grid", "Both" and "Card". Press it.
More about this
Above the graph are the list's own filters: the vault and type choices, then a row of levels and a row of kinds; the answer on sorting and filtering the list shows the first two. Both shows the list and the graph side by side, Grid brings the list back, and Card shows one record. At the top right, Read at and a time say when the vault was read (Oldest data read at when parts were read at different times), and Refresh reads it again. When the list holds more than one vault, the graph says The graph shows one vault at a time: and the vault's name.
In the row of levels, press a level, such as Product.
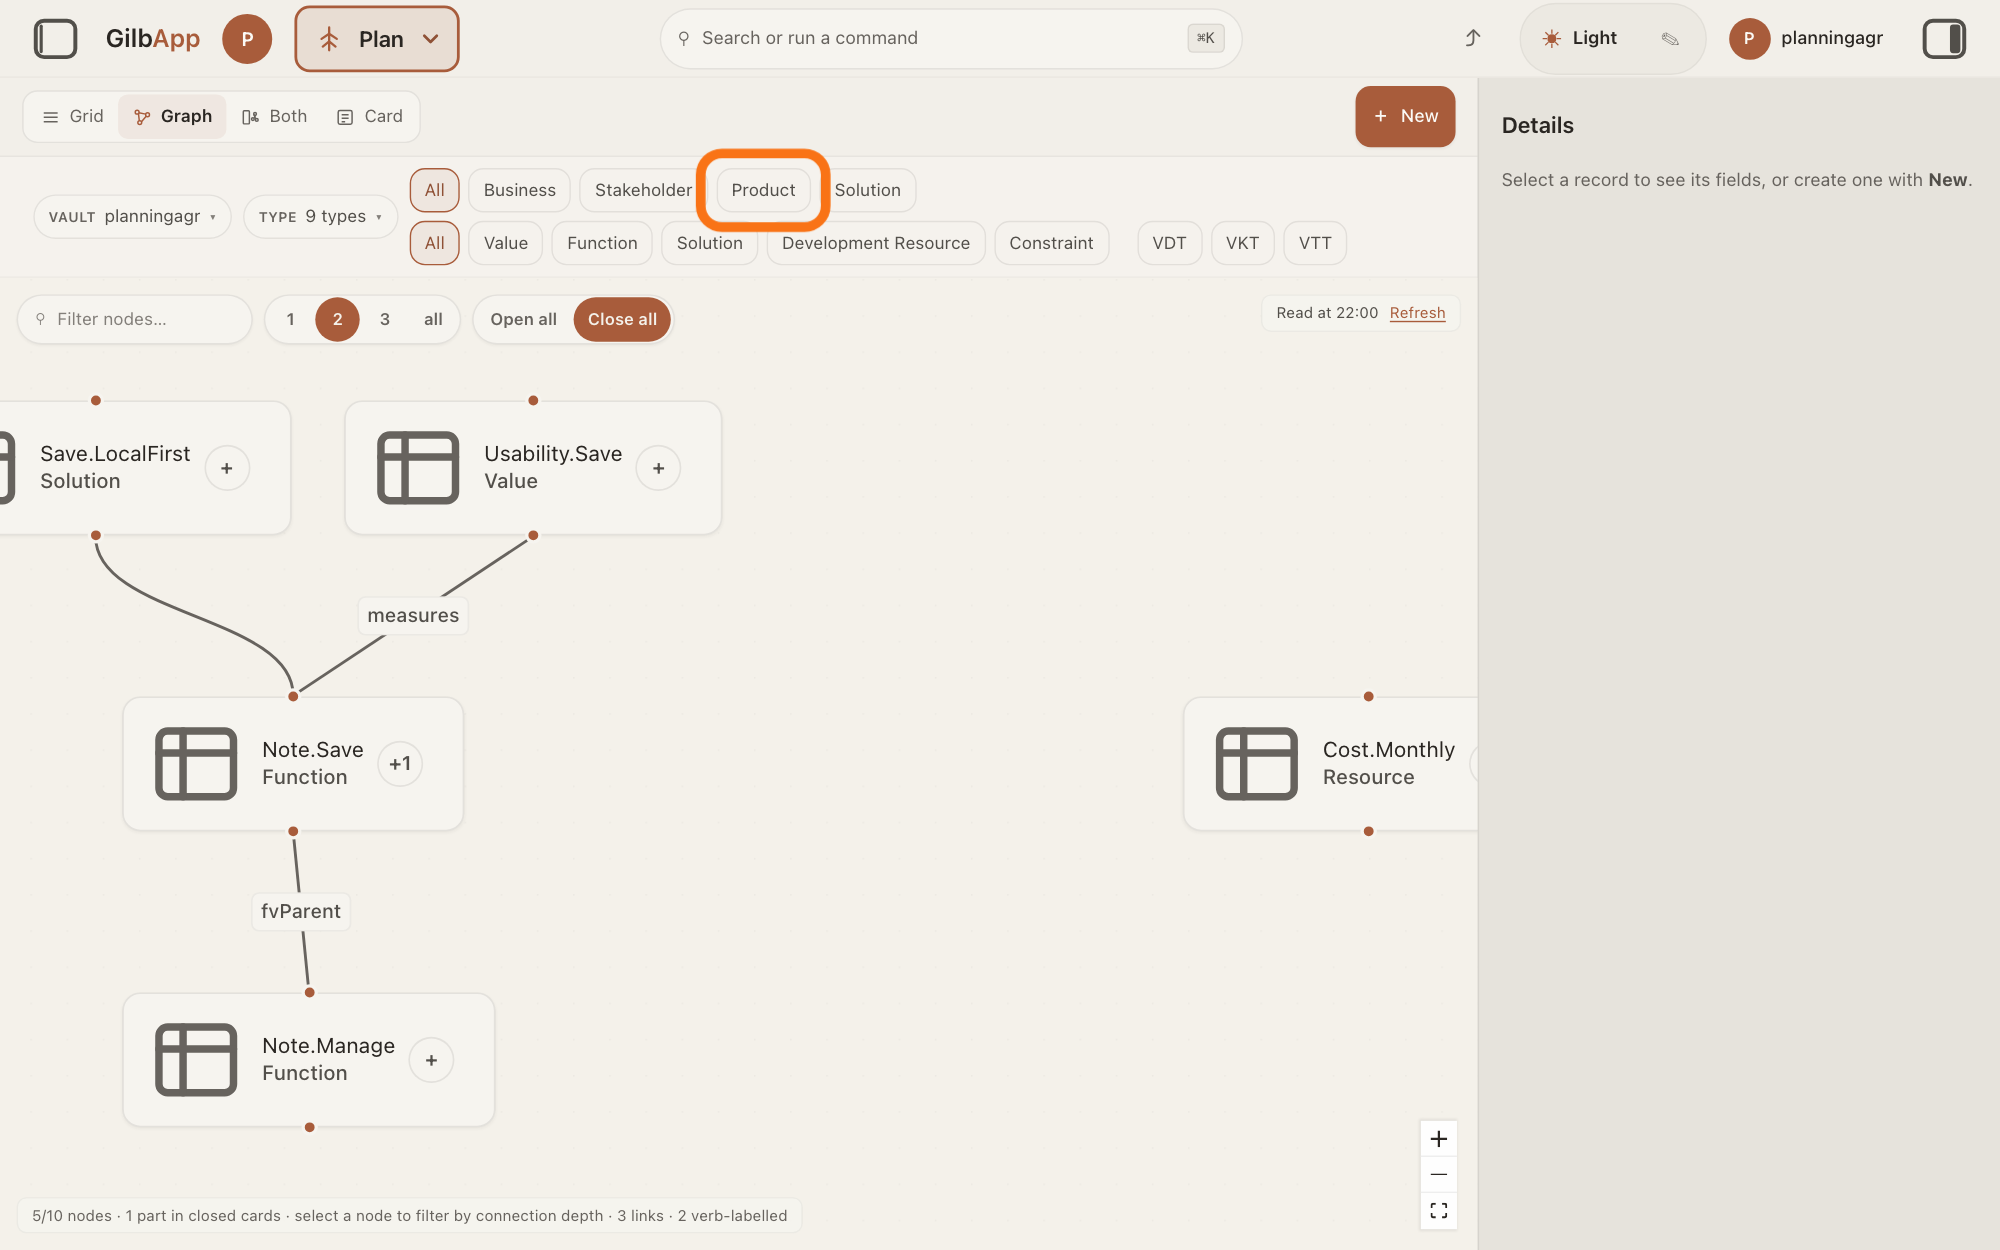
In the row that starts with All, press a level, such as Product: the graph keeps only the cards at that level. The levels are the project's own, Business, Stakeholder, Product and Solution by default.
Show as text
The plan is drawn as a graph of cards and lines, with "Read at" and "Refresh" at the top right. Above it, in the upper row of levels ("All", "Business", "Stakeholder", "Product", "Solution"), press the outlined "Product".
More about this
Press another level to add it, press a pressed one to take it off, and press All to show every level. A Value with no level chosen counts at Product, the level it shows. A Function with no level is left out, and a line under the buttons says so: "… cards have no level set (Functions have no default level), so the level filter leaves them out. Give them a level to include them." Other lines say how many tables (VDT, VKT, VTT) have no level, and how many cards store a level that is not one of the buttons. Kai-Zen writes a plan's levels from the top; the answer on the levels of a plan explains them.
In the row of kinds, press a kind, such as Function.
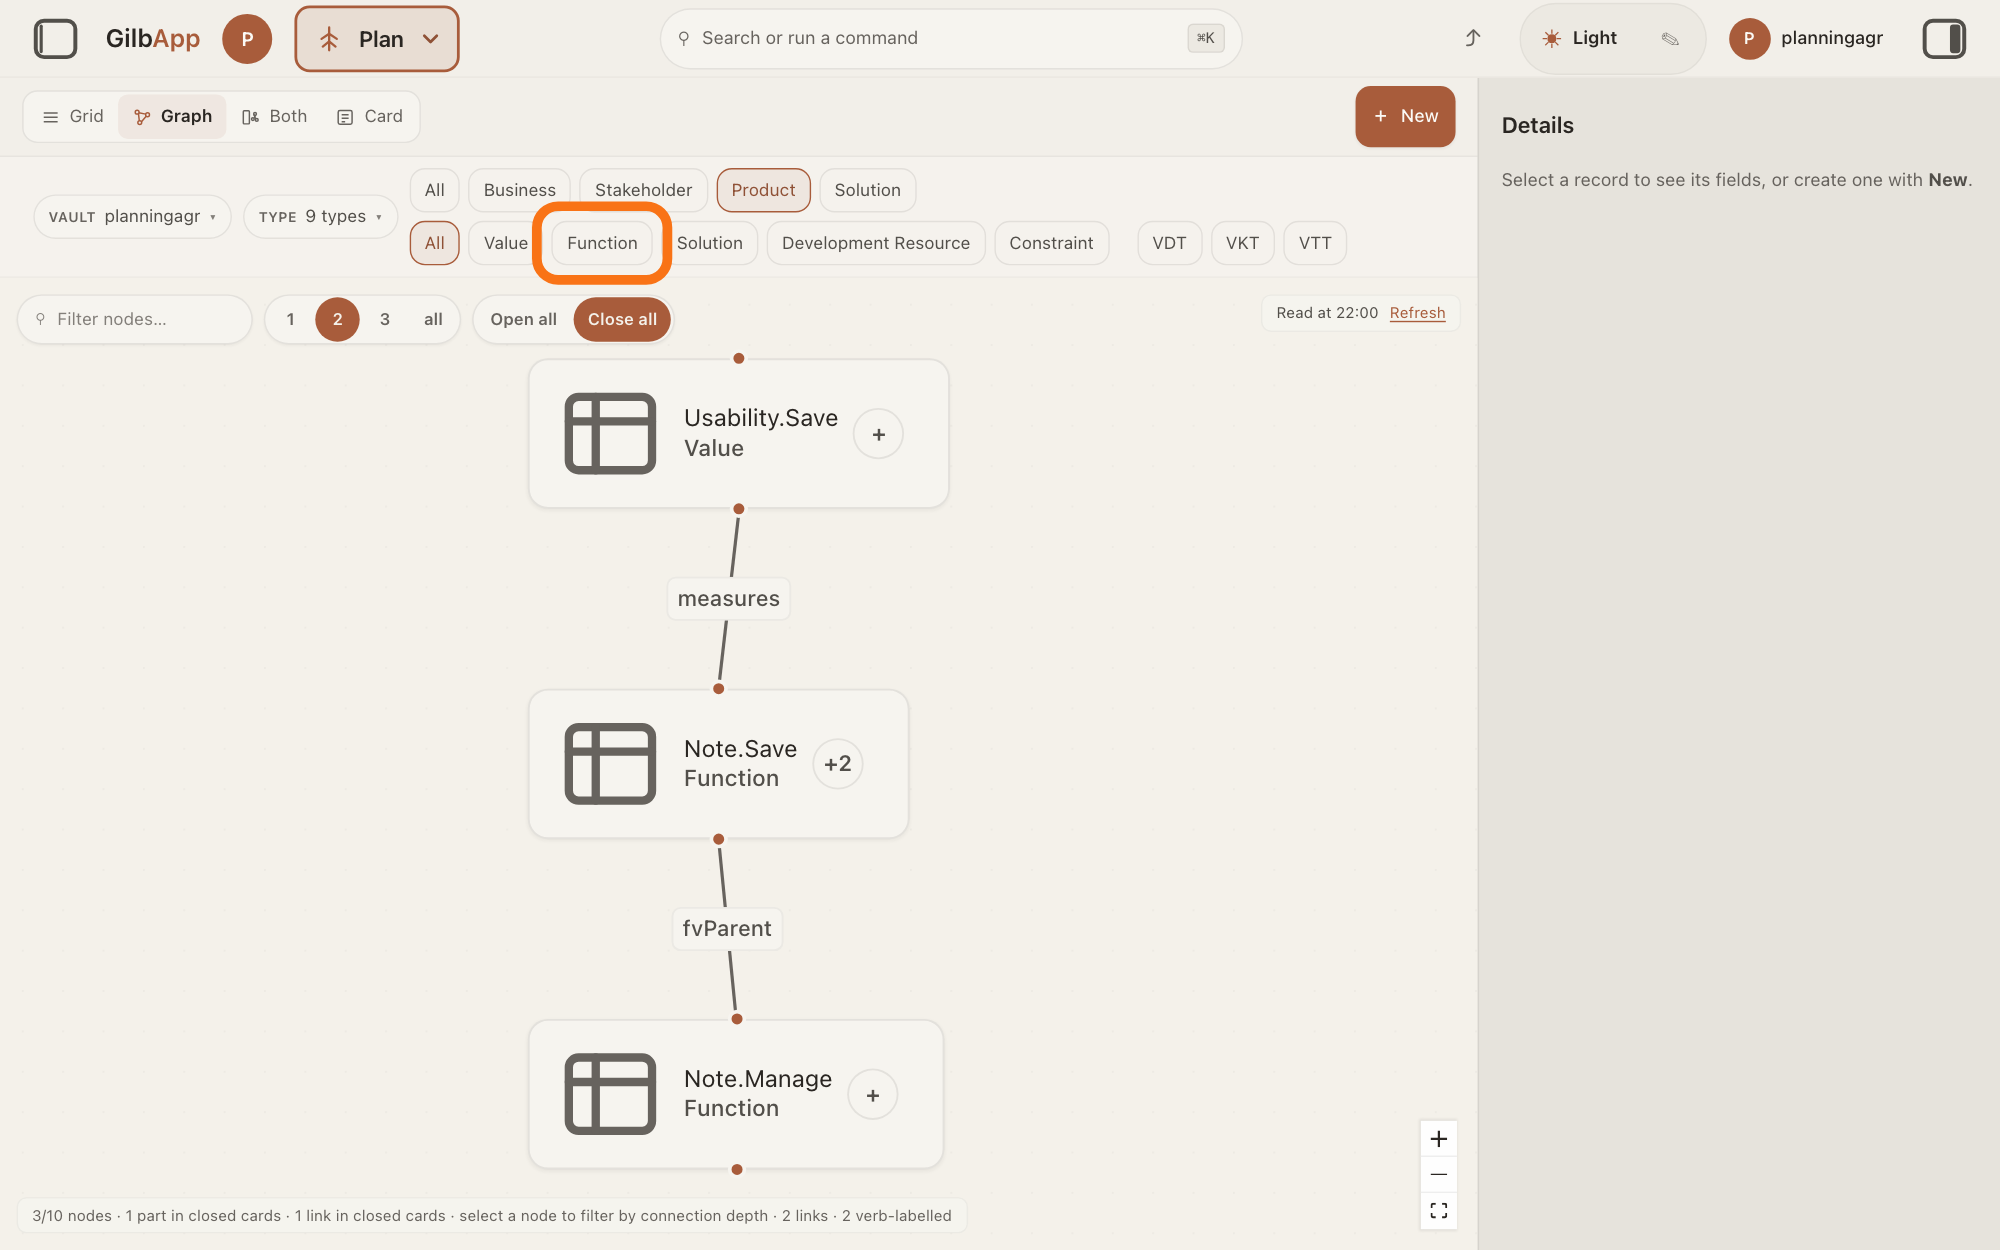
In the second row, press a kind of card: Value, Function, Solution, Development Resource, Constraint, or the tables VDT, VKT and VTT. The graph keeps only the cards of the kinds pressed, at the levels pressed.
Show as text
"Product" is chosen and the graph keeps the cards at that level. In the lower row of kinds ("All", "Value", "Function", "Solution", "Development Resource", "Constraint"), press the outlined "Function".
More about this
Two kinds pressed show both, and All shows every kind. Constraint holds both Function Constraints and Solution Constraints. If the type choice above leaves out the cards a kind needs, a line says … cards are not in the Type selection. with Add them, which adds those types. A card outside the filters that is linked to a card on screen still shows while that card is open (step 5).
Press + on a card to open it.
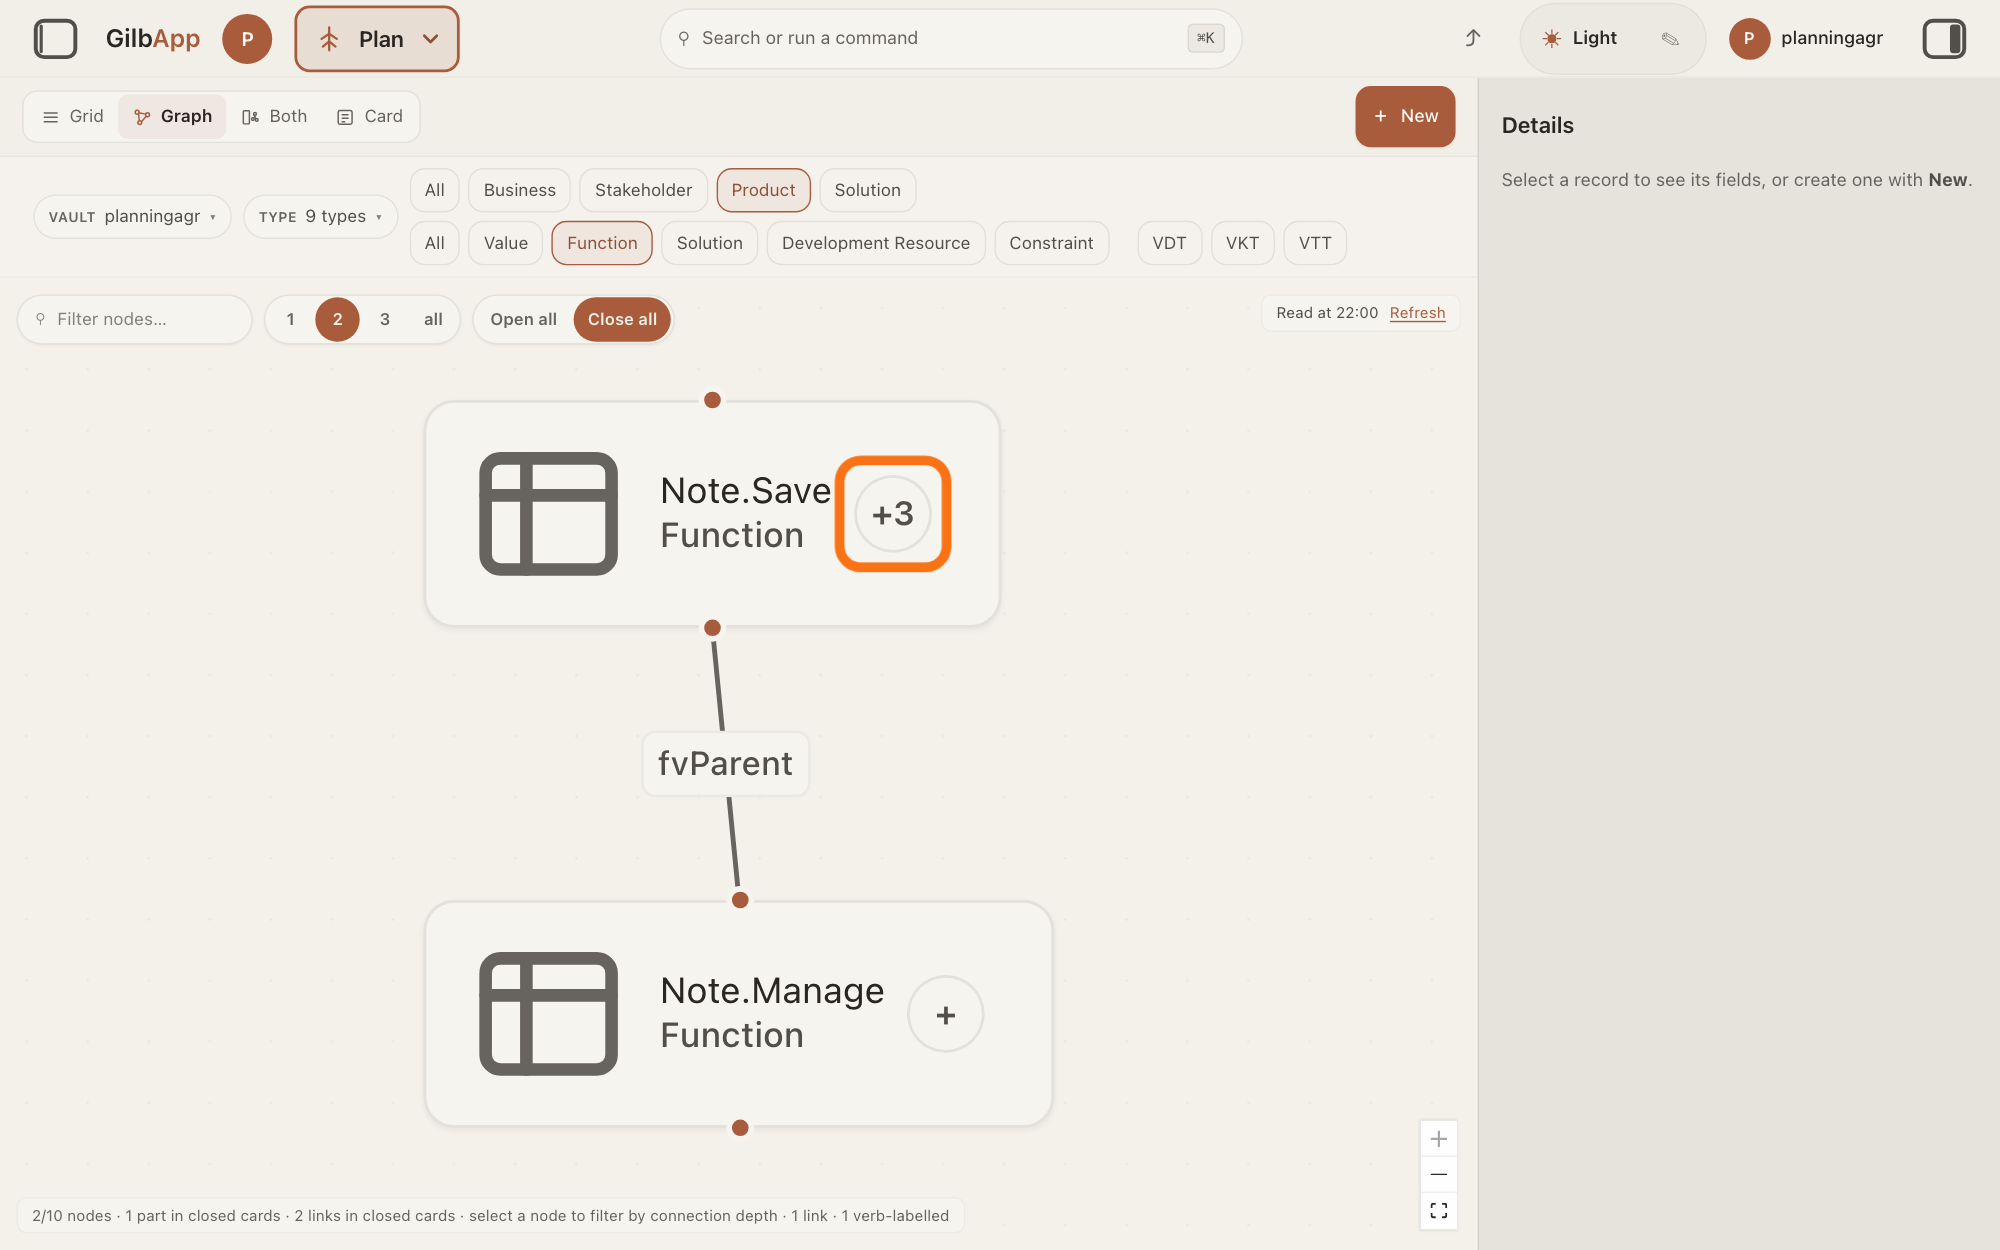
Press the round button at the right of a card; it shows +, or how many parts it hides, such as +2. The card opens and draws its parts and their links.
Show as text
Only the Function cards Note.Save and Note.Manage are left, joined by a line. On the Note.Save card, the outlined round button reads "+3": its hidden parts. Press it to open the card.
More about this
The button then shows −; press it again to close the card. When a card hides no parts, the button shows its lines inside it instead, up to eight, in the words of its card. Open all and Close all, beside the box Filter nodes…, open or close every card. While a card is closed, a link from one of its hidden parts to another card is drawn as one line from the card. A table's row and column lines show only while the table is open; its Values and Solutions are drawn either way.
To see what one card is linked to, choose it.
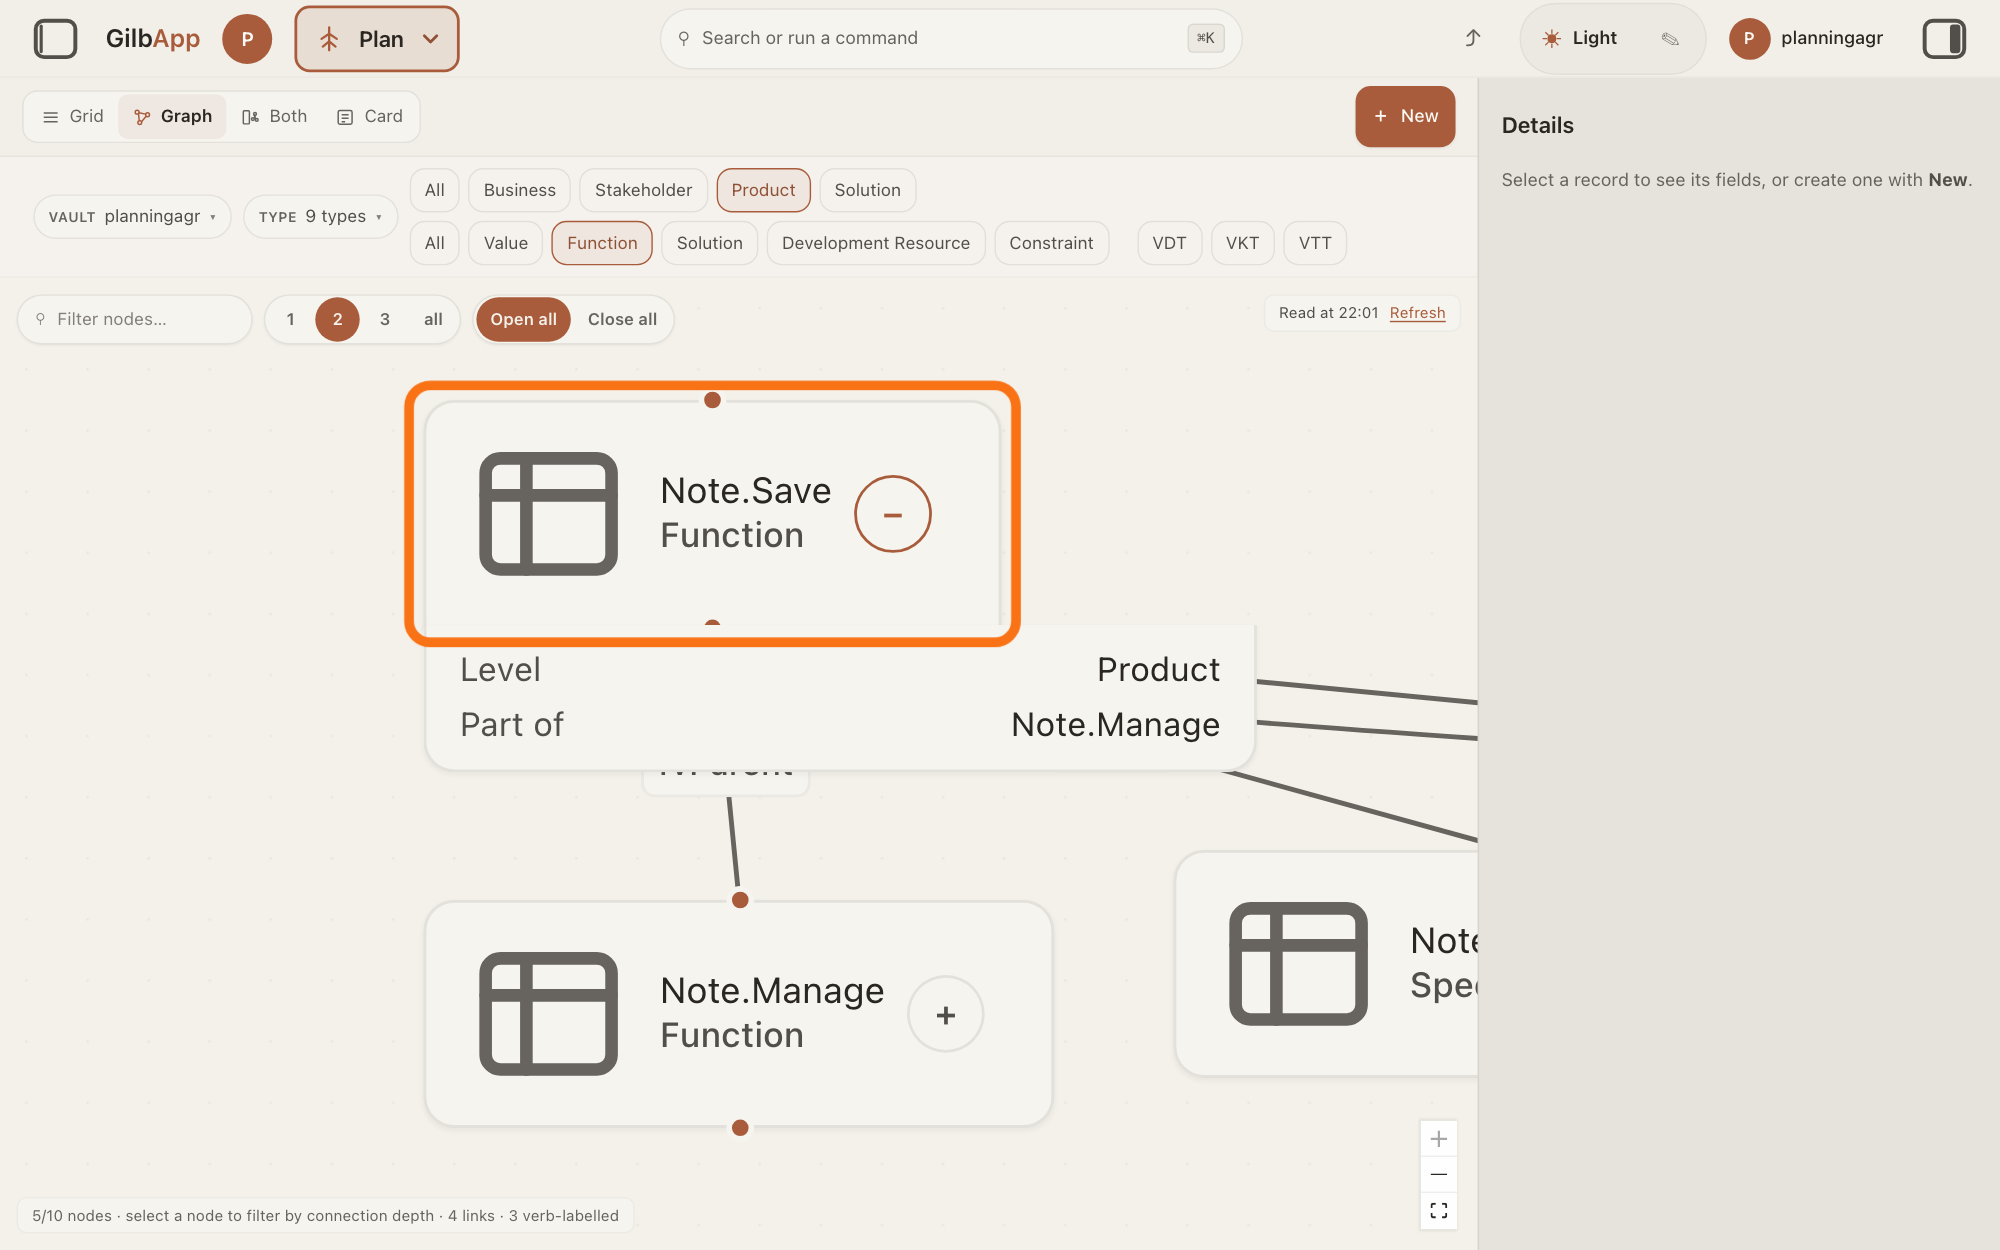
Click the card. GilbApp selects it, lays the graph out again around it, marks its lines; the right pane, when it is open, shows its details.
Show as text
Note.Save is open: its button now shows "−", and its fields "Level: Product" and "Part of: Note.Manage" show under it, with more cards drawn to the right. Press the outlined Note.Save card to choose it and see what it is linked to.
More about this
The buttons 1, 2, 3 and all at the top left then show the cards up to that many links away; Filter nodes… keeps the cards whose name holds what you type. Clicking a line shows the relation under CONNECTION. The answer on seeing how records are connected shows these buttons, the line pane, zooming and drawing a new link.
Deeper
Also asked:
How do I see the plan as a picture? Use the graph: press Main menu, choose Plan and press Graph. Press a level and a kind to choose which cards show, and + on a card to open its parts.
Can I see my plan as a picture instead of a list? Yes: in Plan, press Graph instead of the list. The graph and the list follow the same filters, so what you press in one shows in the other.
The graph and the list follow the same filters: what you press in one shows in the other, because both are kept in the page's address. Within a row, two buttons pressed show the cards of both; between the rows, a card must match both, a level and a kind. The page address also keeps which cards are open.
The graph shows the plan records of one vault, the one open on screen. Cards you drag to another place are not kept: GilbApp lays the graph out again the next time. With more than 200 records it draws no lines.
For the numbers, the GO TO panel in Plan has Table: Values against Solutions, every number worked out. The answer on reading the plan table's charts and numbers explains it.
This answer is written for a computer screen.
Source: GilbApp af0f04ee838a4d55887d2ff1f72edd49a4ff7ca0 (https://gilb.com/app/version.json read 2026-11-10, dirty false), read. Views: RecordsCenter.tsx:80-91 (Grid, Graph, Both, Card), :128-152 (in Plan the Graph has PlanGraphBar above it). Scope: lib/base/planGraphScope.ts:1-3 (The Graph draws exactly the records the Grid would show for the same URL), :24-60; usePlanGraphScope.tsx:1-3, :58-140 (same URL params; one-vault note `The graph shows one vault at a time: ${vaultName}.`), :145-170 (PlanGraphBar = WorkingSetFacets + PlanFilterRows), :175-218 (PlanGraphReadAt: readAt, Refresh, Refreshing…); lib/base/tableReadAt.ts:20-26 (Read at, Oldest data read at); RecordGraph.tsx:2198-2205. Filter rows: PlanFilterRows.tsx:28-60 (All + main levels; All + kinds); lib/base/planFilterRows.ts:1-5 (OR within a row, AND between rows), :18-29 (PLAN_TYPE_GROUPS Value, Function, Solution, Development Resource, Constraint = FunctionConstraint + DesignConstraint, VDT, VKT, VTT), :67-92 (left-out sentences), :140-160 (Value default level, unset/table/foreign), :172-174 (typeGapSentence); PlanFilterRows.tsx:66-103 (notes, Add them). Cards: lib/base/graphClusters.ts:1-10 ("A Plan card ... draws as one node. Its own parts stay hidden until that card is open. A hidden part's link to something outside the card is drawn as one 'via part' line ... A table's row and column lines stay hidden until the table is open; the Values and Solutions stay drawn." and ?gco= URL state); graphNodes.tsx:257-343 (toggle face +, +N, −; fields toggle when nothing is hidden), lib/base/graphCardFields.ts:1, :13 (CARD_FIELD_ROW_MAX 8, Same order and words as the Card view); RecordGraph.tsx:463-515 (records outside the filter drawn while a linked card is open), :2290-2325 (Open all, Close all). Select, depth, filter, line, 200 cap, drag not kept (RecordGraph.tsx:1807-1877, :2222-2290; graphRelationCount.ts:41-46; graphHooks.ts:39, :80; RecordGraph.tsx:10-11). GO TO panel Table: gilbAppMenuRows.ts:176-177. Before you start names the Functions at Product the pictures show: lib/base/planKinds.ts:207-213 (planLevelDefault gives a Function none), lib/base/planFilterRows.ts:74-79 (levelUnsetSentence) Also: Kai-Zen.VDT.
Checked against GilbApp d529620.