
← Back to How do I read the plan as a graph?
How do I read the plan table's charts and numbers?
Short answer
Press Main menu, choose Plan, press it again, choose Table and the Levels; read the numbers in the table and the charts below.
Before you start
You need to be signed in to GilbApp on a computer, with a vault you can read. The plan needs Values with Status, Tolerable and Goal numbers, a Development Resource with Status and Budget, and Solutions with impacts on them; the answer on comparing Solutions in a VDT shows how to write an impact. The pictures show a made-up person on a test site; your screen shows your own name and address.
Words used here (8)
- GilbApp
- GilbApp is the app, opened in a web browser at https://gilb.com/app, where you open, fill and share your vaults.
- Budget
- A Budget is the most of a Development Resource you plan to use, such as the money for one month.
- Kai-Zen
- Kai-Zen is the planning agent: it finds out what you want, chooses the way, hands the work to other agents and reports back.
- record
- A record is one piece of data with its own address, such as a person, a place, a thing or a note.
- Value Decision Table
- A Value Decision Table (VDT) is a table that ranks options by how much they move the level's Values for their cost.
- project
- A project is work to bring about a change you want, such as a new app or a better way of doing something.
- Experience Level
- An Experience Level is a whole number from 0 to 10, chosen under an impact, that says how much experience stands behind its number.
- Value Tracking Table
- A Value Tracking Table (VTT) follows a project's Values and Development Resources across its steps: the Estimate of each step, then its Actual.
Steps
Press Main menu at the top left and choose Plan.
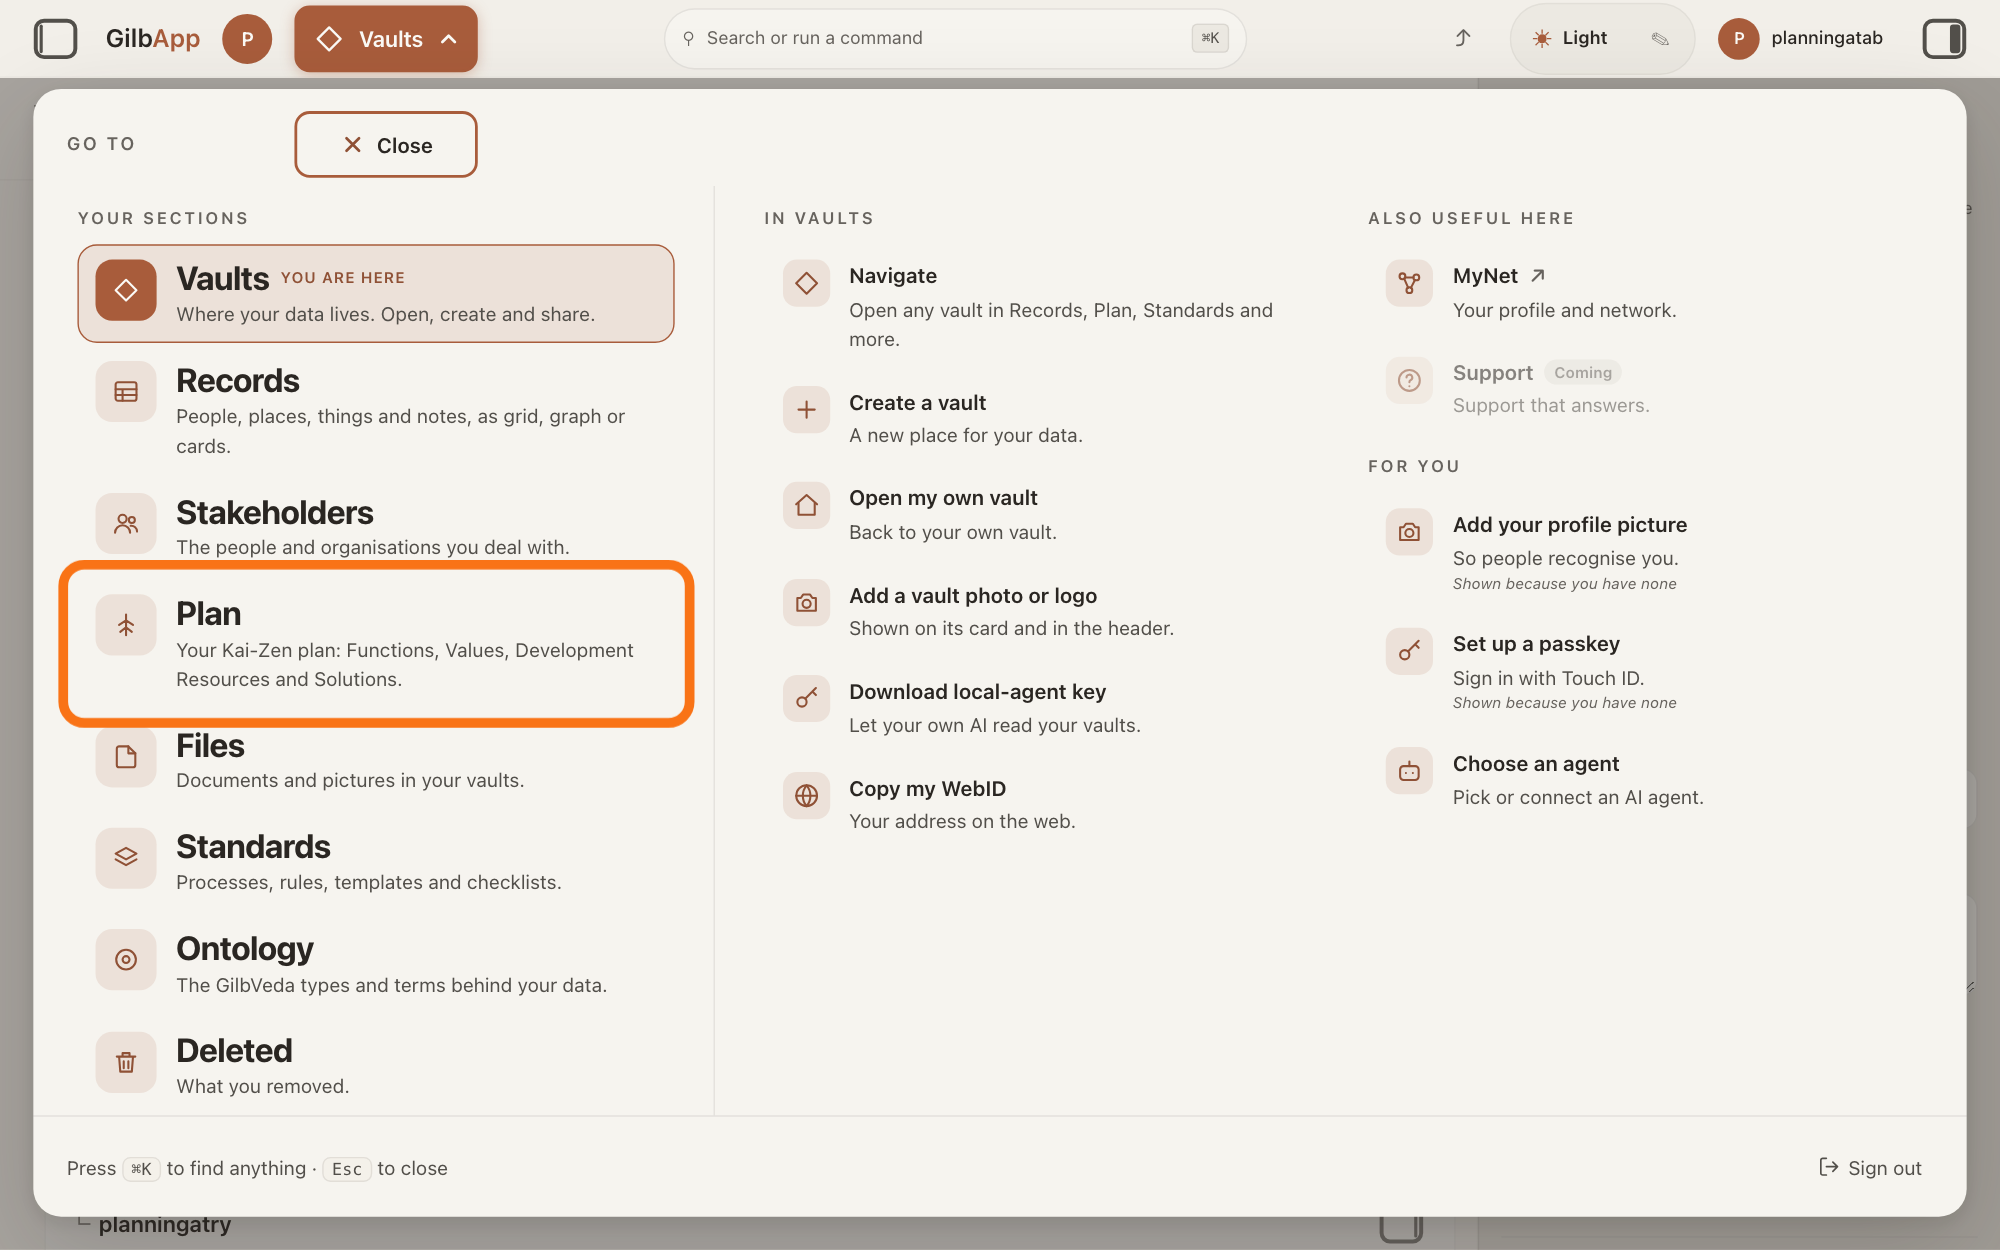
Press Main menu, next to your profile picture at the top left, and under YOUR SECTIONS choose Plan. The button shows the name of the section you are in, such as Vaults.
Show as text
The "GO TO" panel is open over the screen. Look in the left column under "YOUR SECTIONS": the outlined row is "Plan", with the line "Your Kai-Zen plan: Functions, Values, Development Resources and Solutions." Press it to open the Plan screen.
More about this
A panel headed GO TO opens; Plan reads Your Kai-Zen plan: Functions, Values, Development Resources and Solutions. You can also press the Plan button on the card of a vault (the place where a person or a group keeps their records) in Vaults. The Plan screen lists your plan records and has the views Grid, Graph, Both and Card.
Press Main menu again and choose Table.
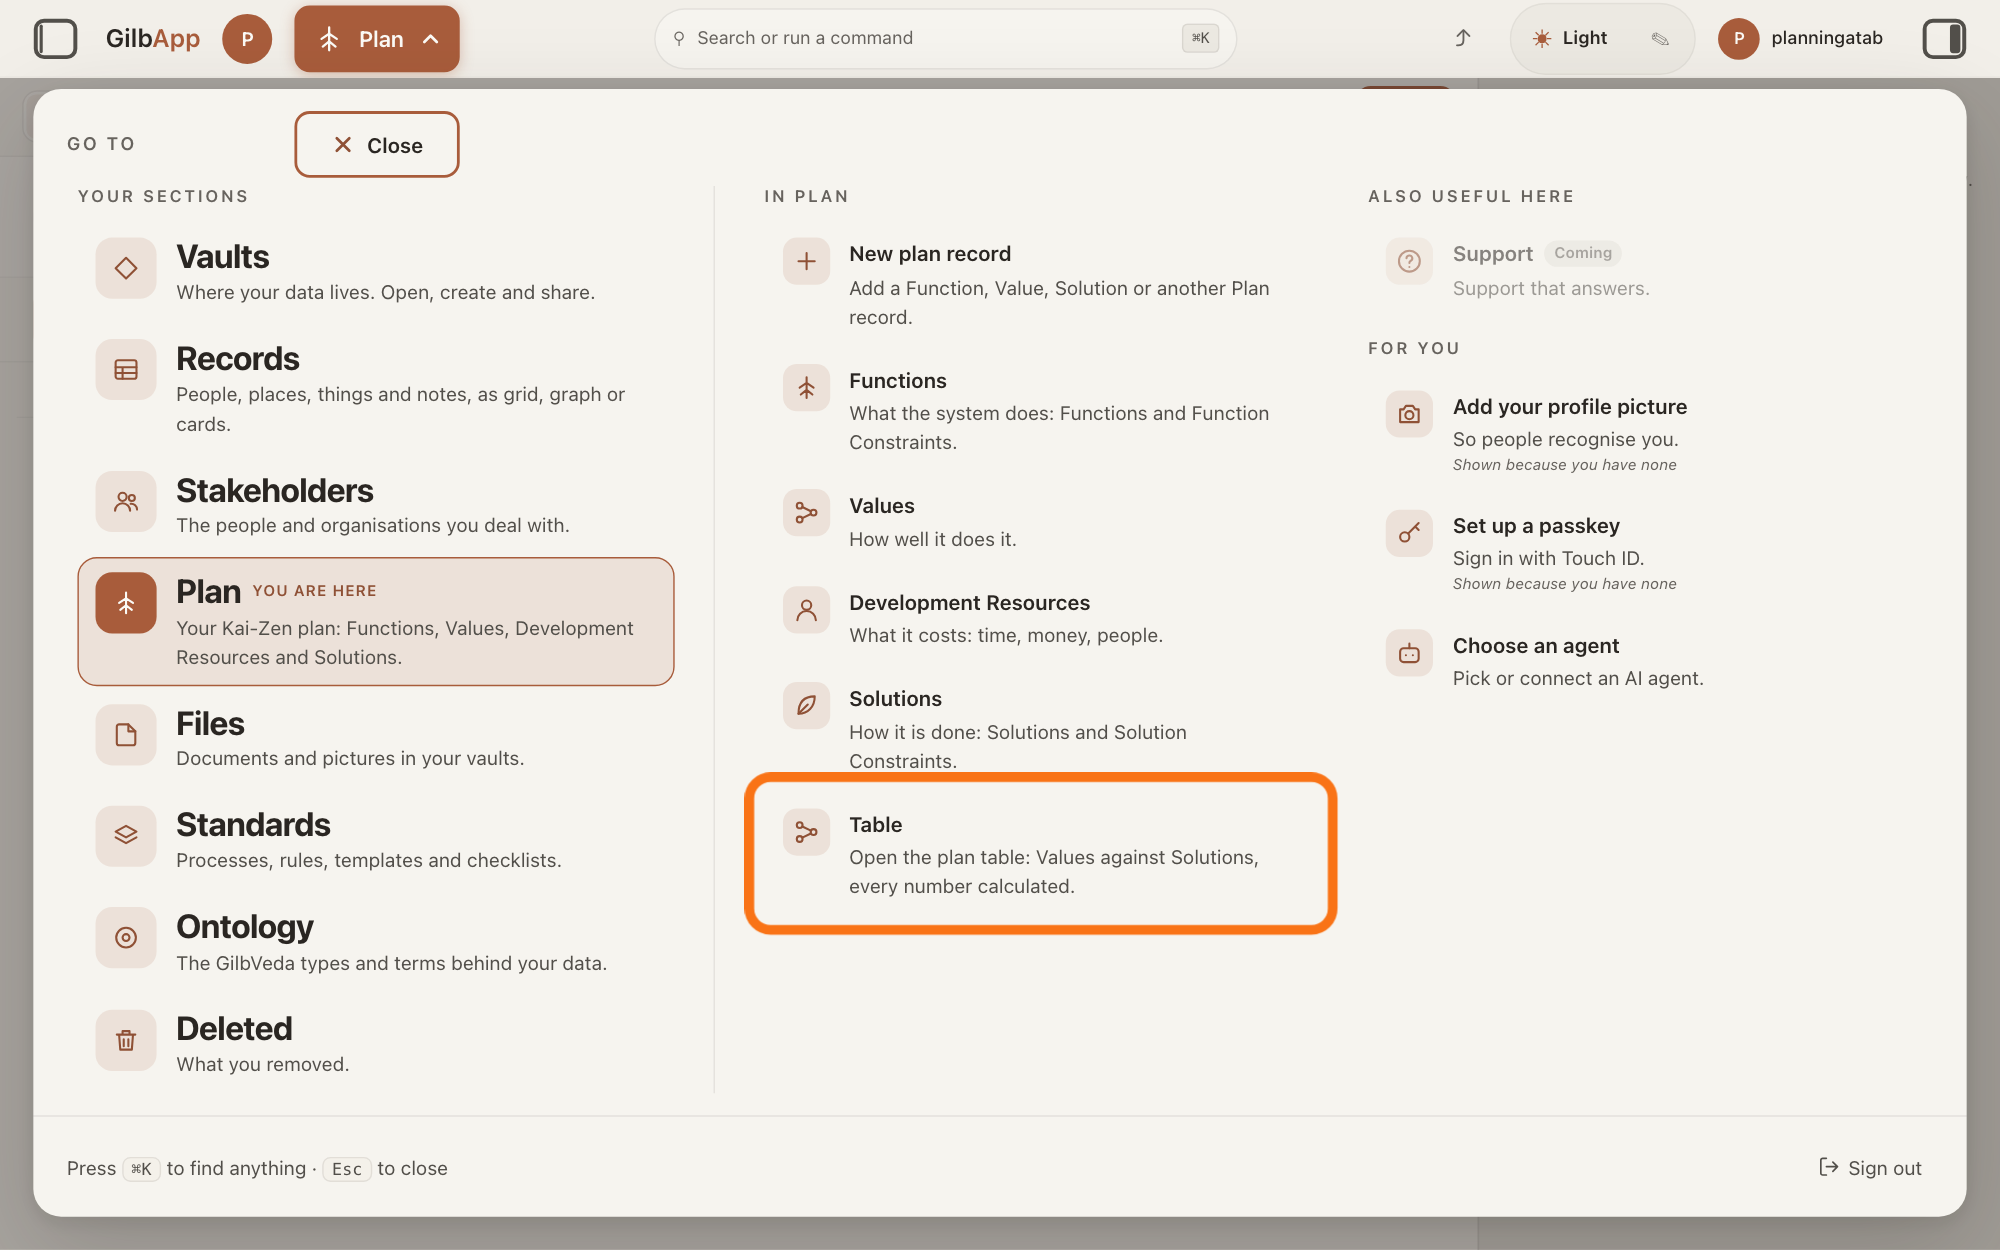
Press Main menu and, among the choices for Plan, choose Table (Open the plan table: Values against Solutions, every number calculated.). The table opens, headed Plan table:, the vault's name and today's date.
Show as text
You are in "Plan" and the "GO TO" panel is open again. In the middle column under "IN PLAN", the outlined row is "Table", with the line "Open the plan table: Values against Solutions, every number calculated." Press it.
More about this
It holds every Solution that has an impact and every Value and Development Resource it changes; you file nothing for it, unlike a Value Decision Table (VDT), a table that ranks options by how much they move the level's Values for their cost. Beside the heading, Read at and a time say when your plan was read (Oldest data read at when parts were read at different times), and Refresh reads it again. With no impact yet it says "No Solution has an Impact yet. Add one on a Solution card, and its column appears here." A warning line above the table has Dismiss, and Dismiss all when there are two or more.
Under Levels, choose a pair of levels.
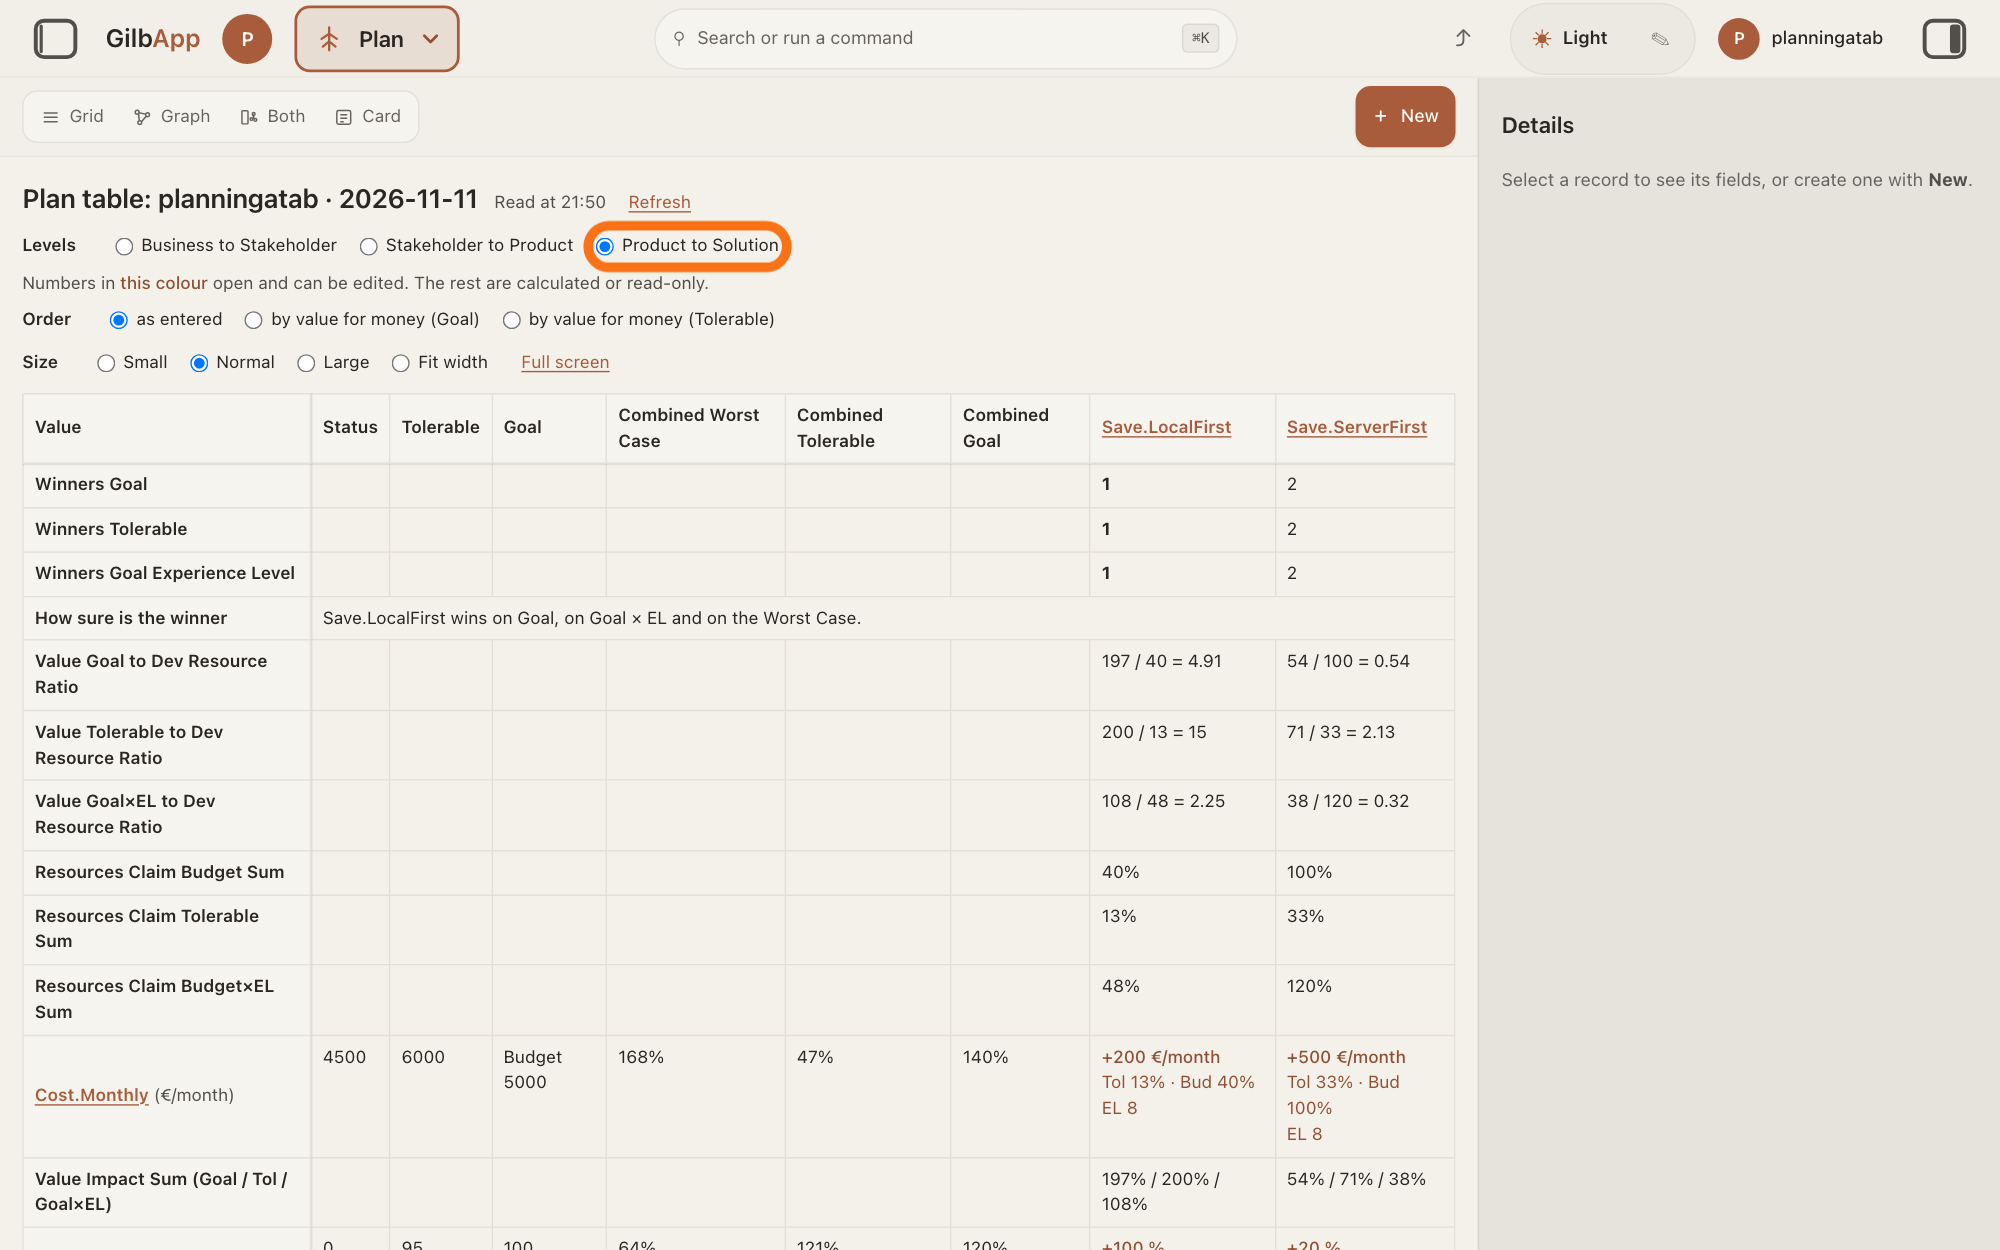
Under Levels, choose the pair to compare, such as Product to Solution: the rows are the first level's Values and the Development Resources, and the columns what the second level holds. The table opens on Product to Solution.
Show as text
The plan table is open, headed "Plan table:" with your vault and today's date. On the "Levels" line, the outlined choice is "Product to Solution", already chosen; the other pairs are "Business to Stakeholder" and "Stakeholder to Product".
More about this
The pairs are the project's levels side by side, such as Business to Stakeholder and Stakeholder to Product. There the columns are the Values of the level below, and with no Development Resource row the table has no ratios, no Order, no Graphics and no best set: a Value draws no development cost. Kai-Zen writes a plan's levels from the top, and at each one a VDT picks what the next level holds; the answer on the levels of a plan explains them.
Press a cell where a Solution meets a Value.
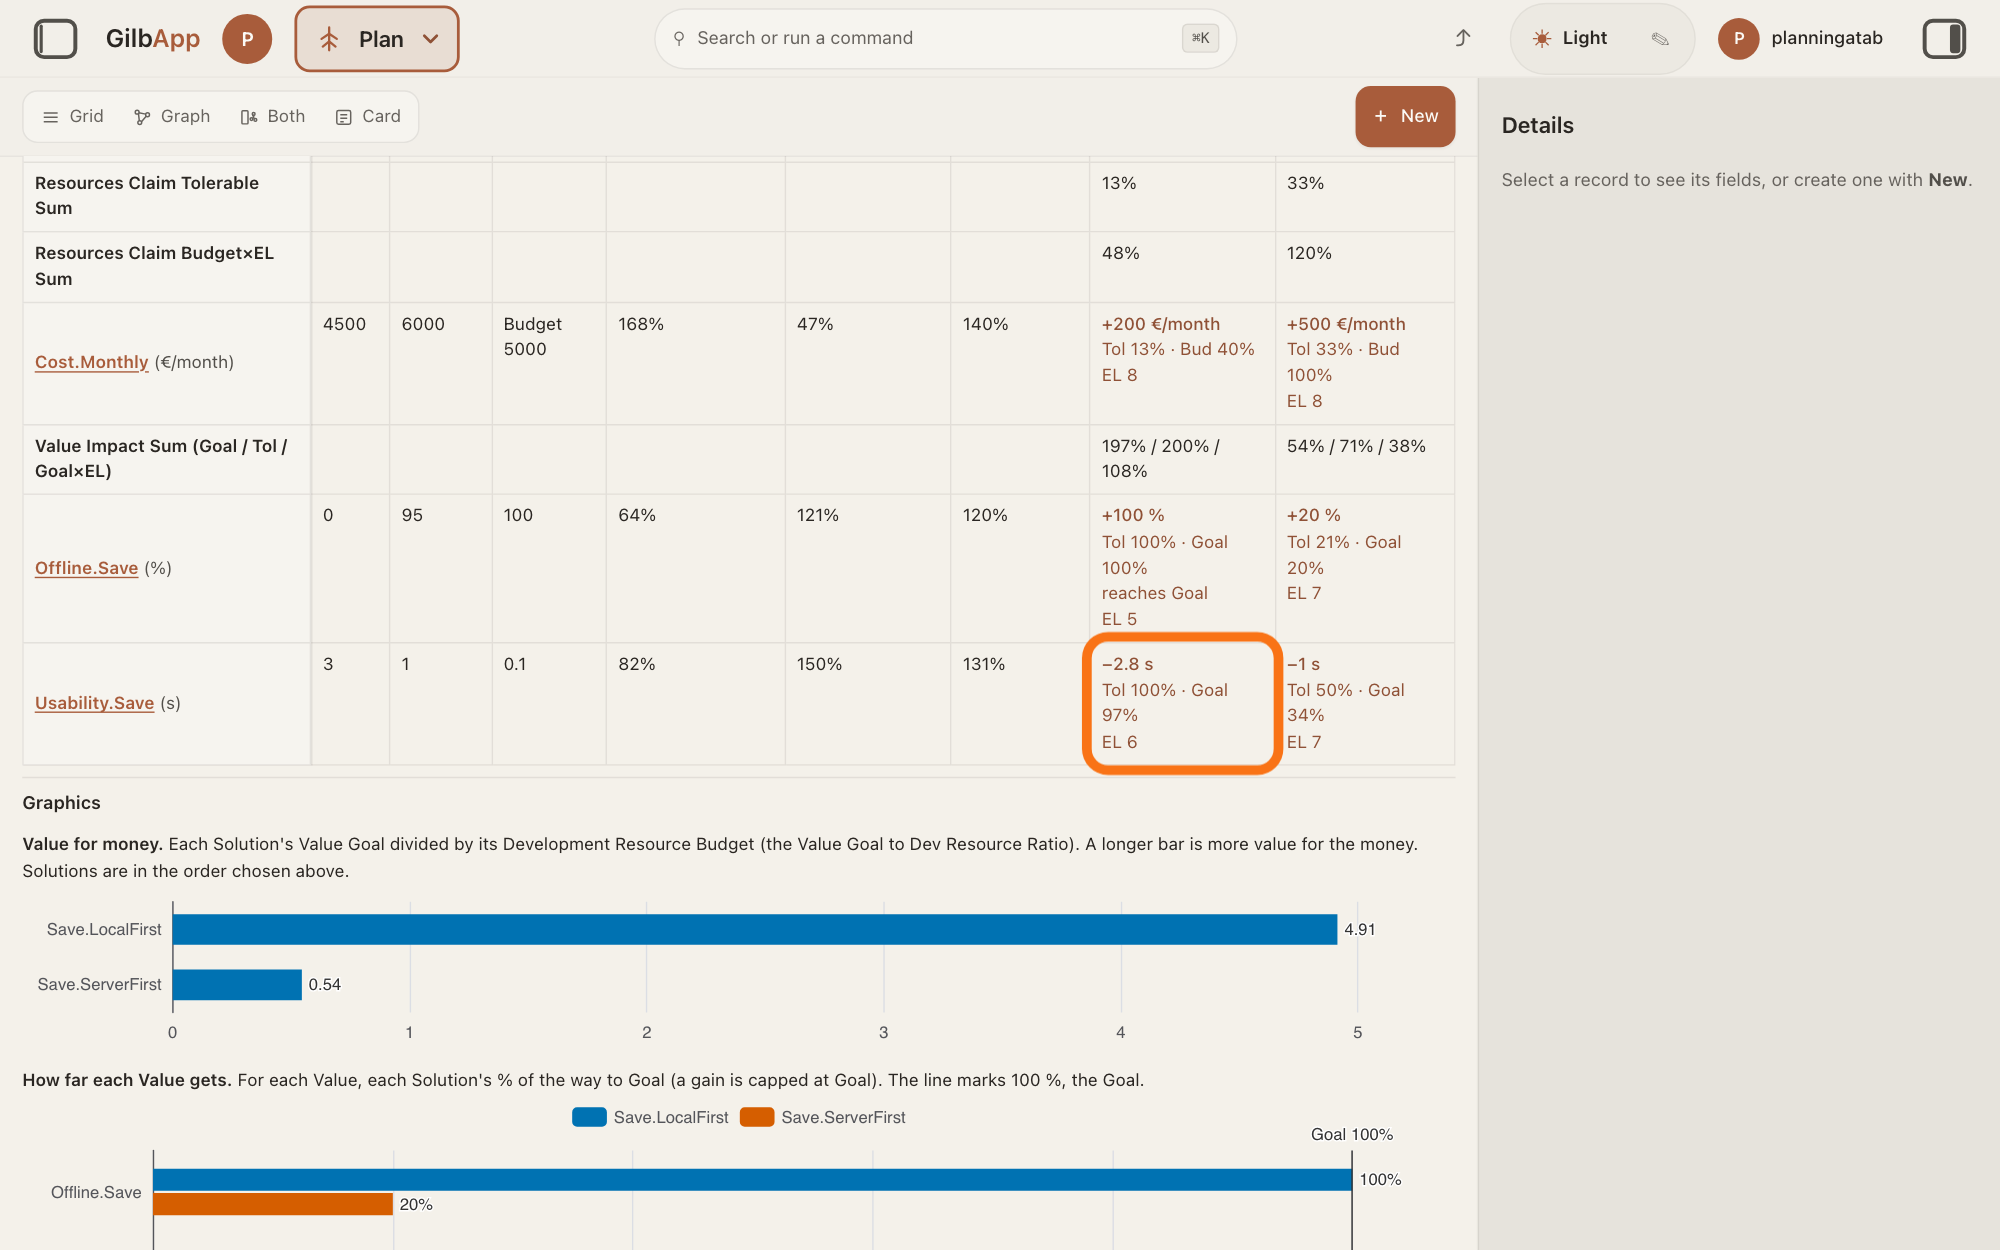
Press the cell in a Solution's column and a Value's row; the right pane shows that impact under IMPACTS. The cell shows the change, then Tol and Goal with a %: how much of the way from Status to Tolerable, and to Goal, that Solution alone goes.
Show as text
The table is scrolled down to the Value rows, below the rows of sums, ratios and "Winners". The outlined cell is where Save.LocalFirst meets Usability.Save; it reads "−2.8 s", its "Tol" and "Goal" % and "EL 6". Press it.
More about this
A Resource's cell shows Tol and Bud, toward its Tolerable and Budget. EL (the Experience Level, how much experience stands behind the number) shows its number, and the evidence follows. With no Tolerable or Goal on the Value, the cell says No % yet. Every % is a whole number: the table shows the direction, not precision. The line above the table says "Numbers in this colour open and can be edited. The rest are calculated or read-only.", or You can open every number to read it. None can be edited here. The answer on comparing Solutions in a VDT shows how to write an impact in the pane.
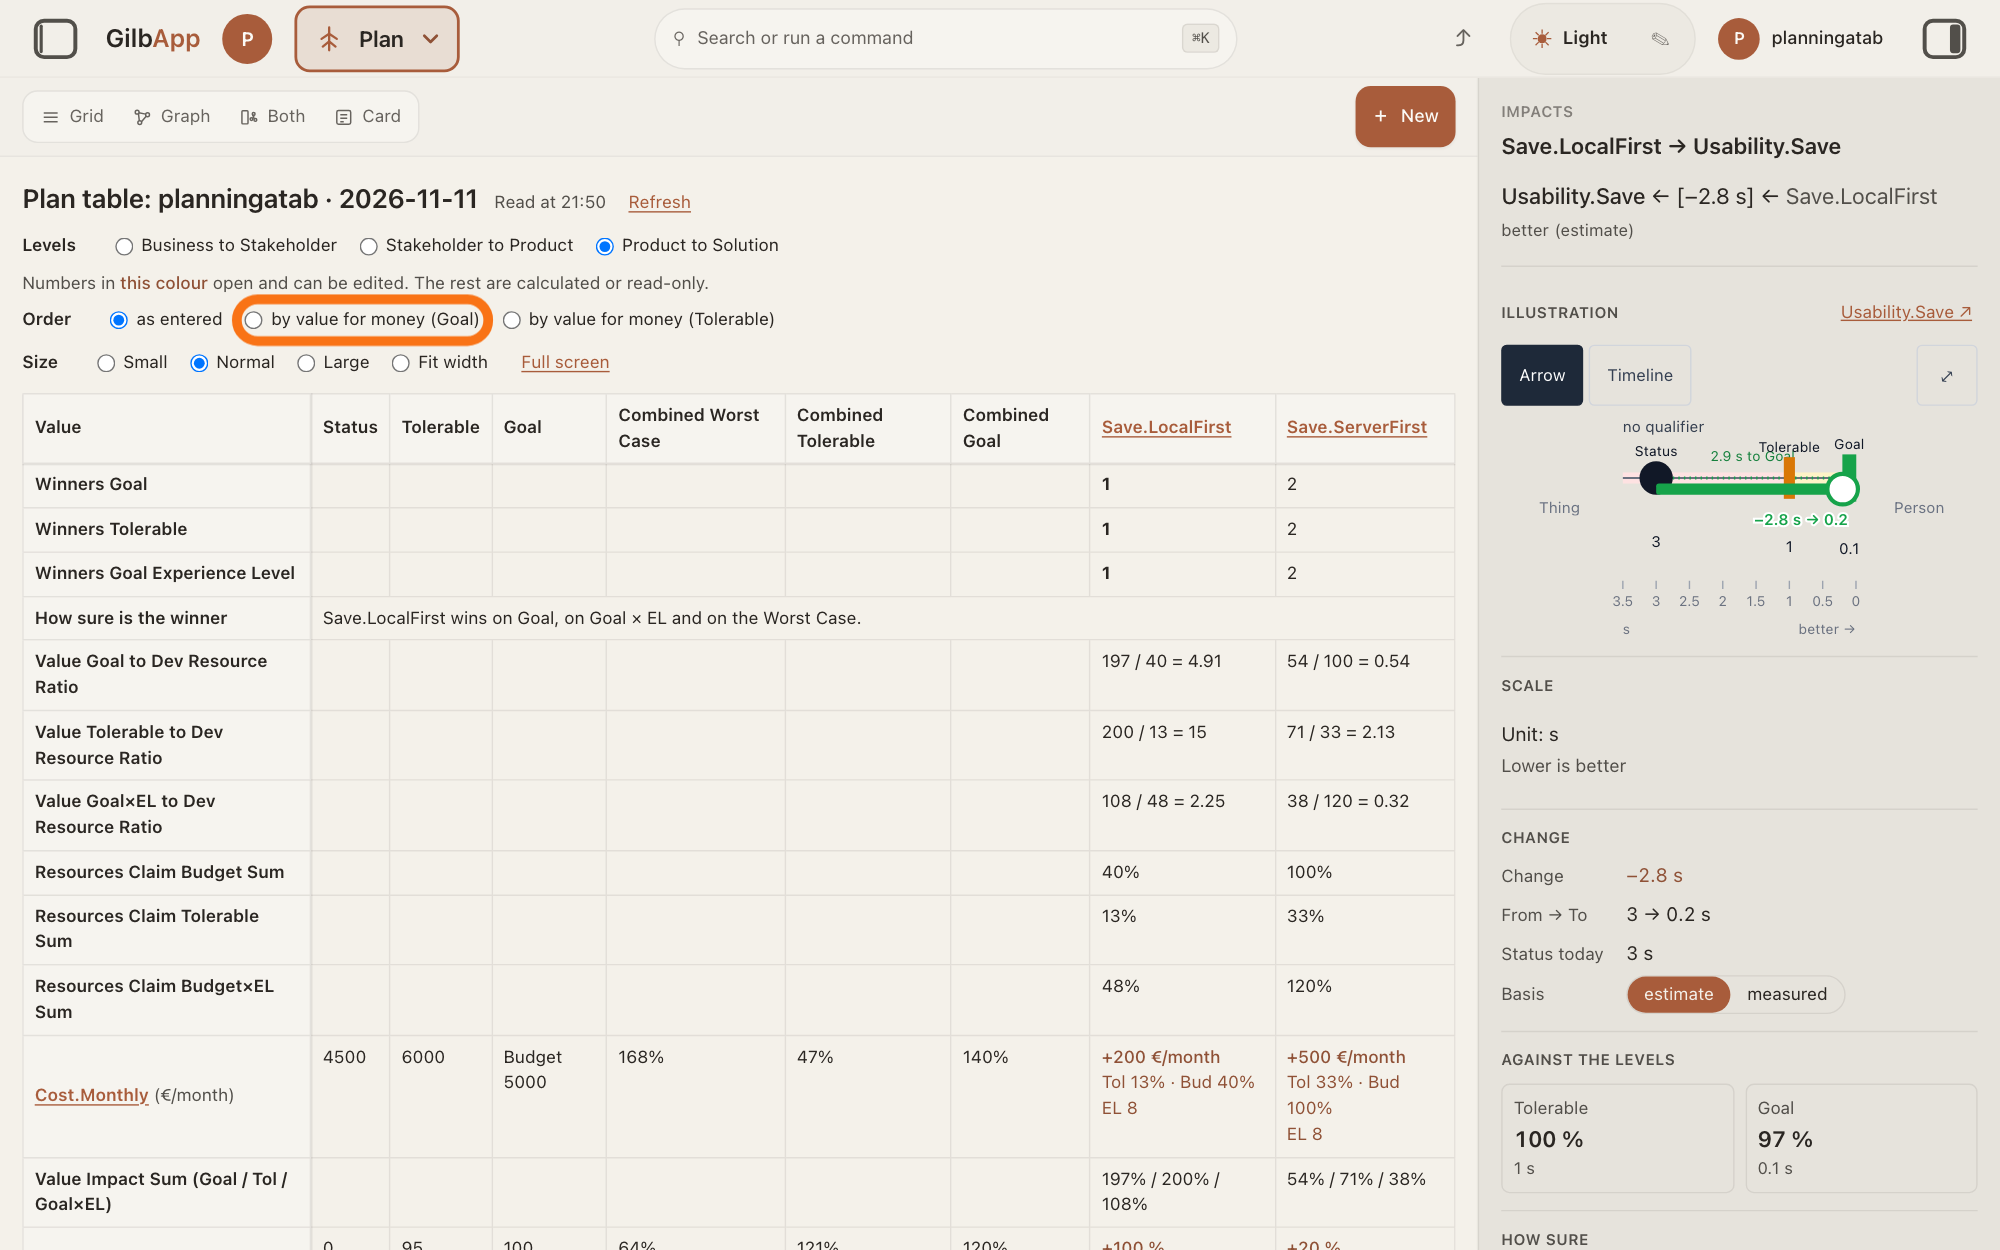
Under Order, choose by value for money (Goal).
Under Order, choose by value for money (Goal) to put first the Solution that gives the most Value for its cost. by value for money (Tolerable) ranks by the Tolerable ratio instead, and as entered puts the columns back.
Show as text
The right pane shows "IMPACTS" for "Save.LocalFirst → Usability.Save". On the "Order" line above the table, "as entered" is chosen; press the outlined "by value for money (Goal)".
More about this
Only where the columns stand changes: no number and no Winners place moves. A Solution with no cost goes last and says no cost yet. The order stays while the page is open and is not stored, and the first chart under the table follows it. In a Value Decision Table you take a Solution out of the table, not out of the vault, with its × in + Add Ends & Means. In a Value Tracking Table, ← and → there move a step left or right: its columns keep the delivery order.
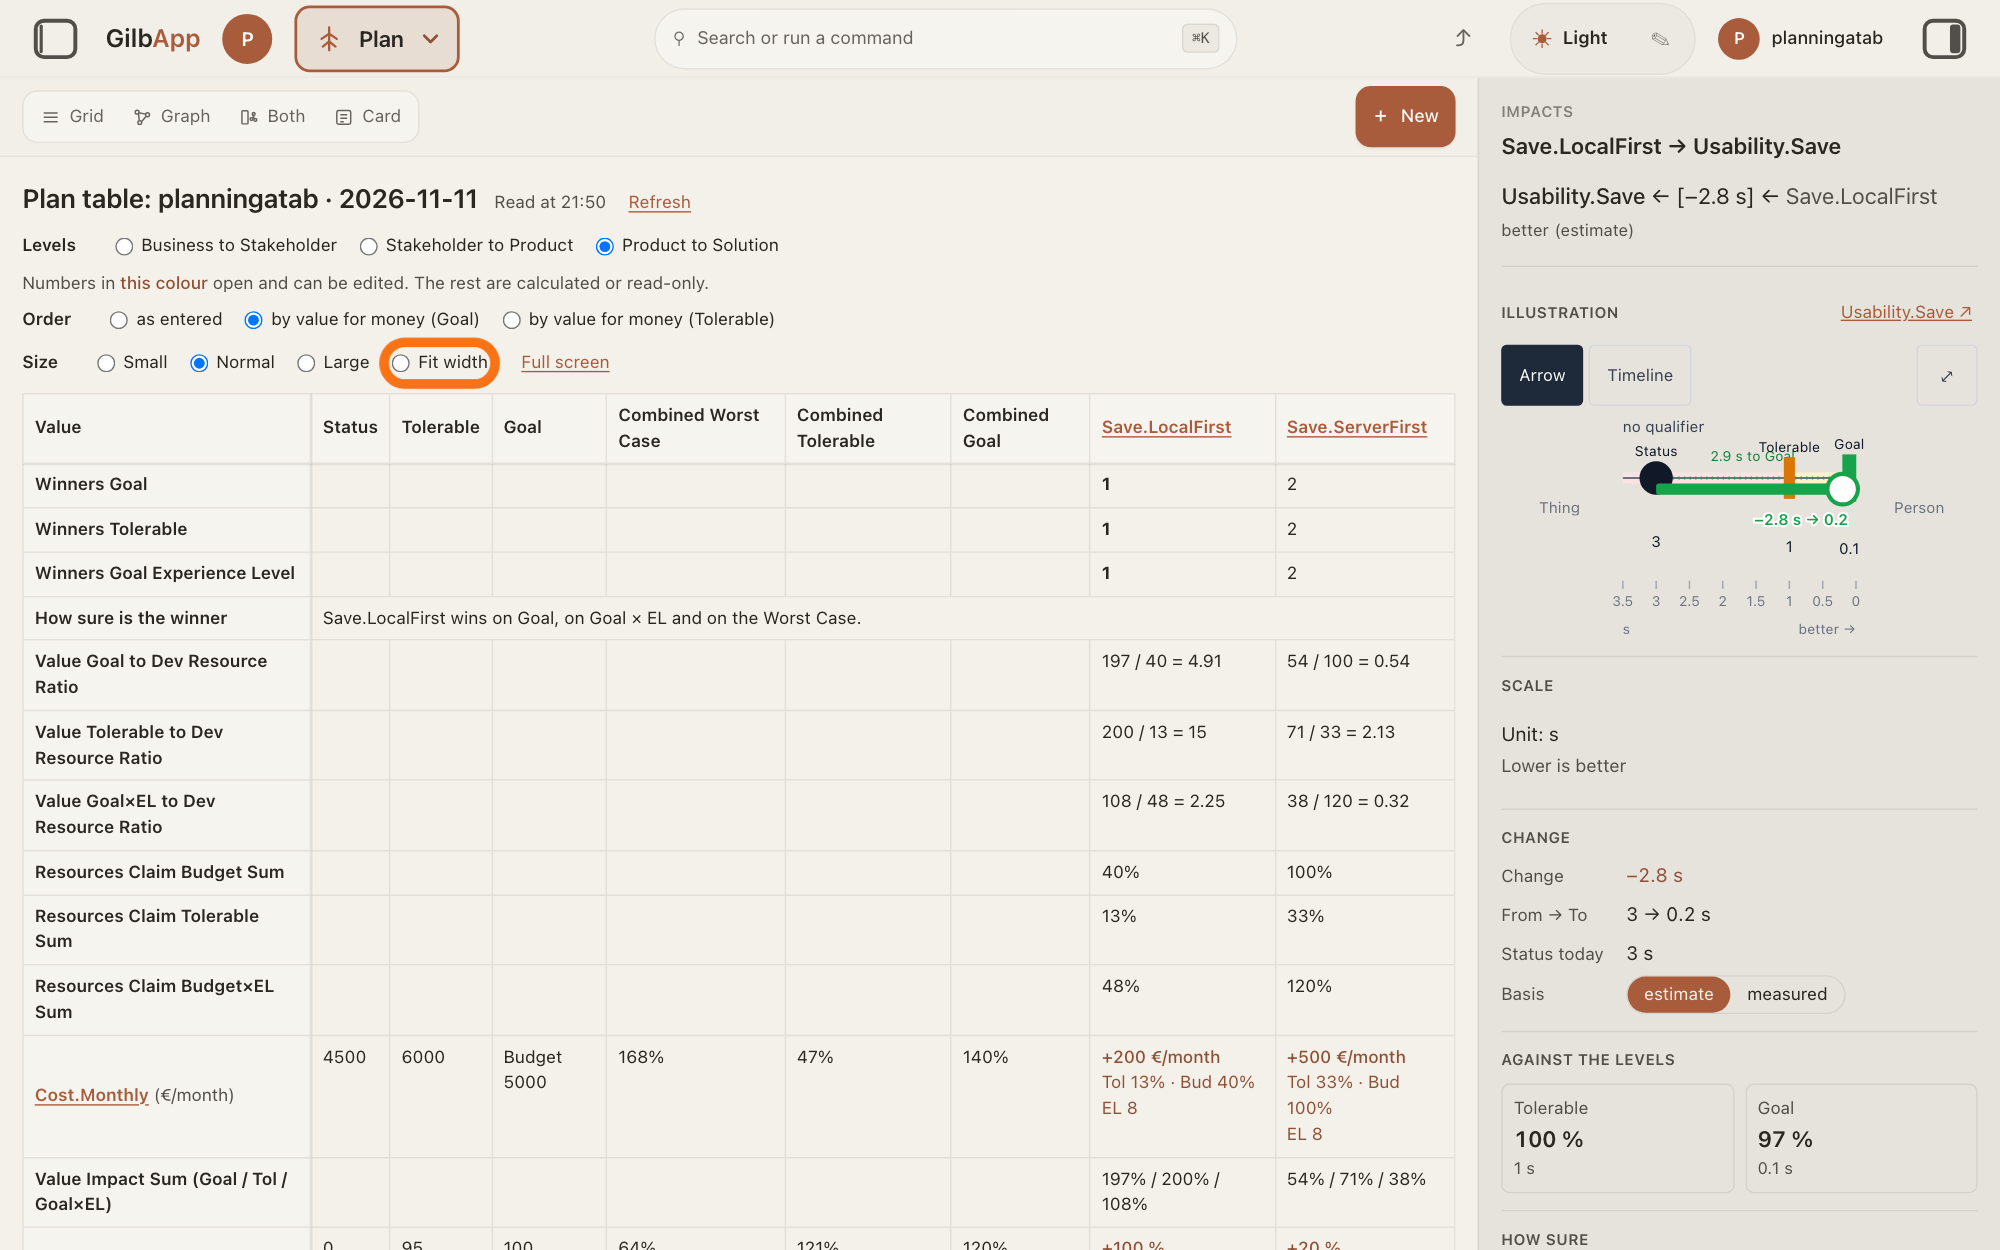
Under Size, choose a size.
Under Size, choose Small, Normal, Large or Fit width, the largest size that fits without scrolling sideways. Your choice is kept in this browser, not in the vault.
Show as text
The columns are now ordered by value for money (Goal). On the "Size" line, "Normal" is chosen; the outlined choice is "Fit width". Choose the size that suits your screen.
More about this
Full screen beside it shows the table alone over the whole window, with the first row and the first column kept in view; ✕ beside Value in the top left corner closes it. A cell pressed in full screen opens its pane beside the table, with Close.
Scroll down to Graphics under the table.
Under the table, Graphics draws two charts. Value for money has one bar per Solution, its Value Goal divided by its Development Resource Budget: a longer bar is more value for the money.
More about this
How far each Value gets shows, for each Value, each Solution's % of the way to Goal, a gain capped at Goal, with a line at 100 %, the Goal. The charts are drawn as they come into view; one that cannot be drawn says The chart could not be drawn just now. The numbers are in the table below it. With nothing to draw they say No Solution to draw yet. or No Value has a number to draw yet. Below them, a line that starts Best set (Kai's rule: Tolerable first, then Goal, within Budget): lists the Solutions to take first, then the Budget used, the Values still below Tolerable and those that reached Goal.
Deeper
Also asked:
What is Table under Plan? The plan table: Values against Solutions, every number calculated, for the whole plan. Under Levels you choose which pair of levels it shows.
Above the Values, rows add up each Solution's column. Value Impact Sum (Goal / Tol / Goal×EL) adds the Values' % of the way to Goal, to Tolerable, and the Goal % weighted by the Experience Level; the Resources Claim rows add the same for the Development Resources. The three ratio rows, such as Value Goal to Dev Resource Ratio, divide the one by the other: how much Value the Solution gives for its cost. Winners Goal, Winners Tolerable and Winners Goal Experience Level rank the Solutions by those three ratios; 1, in bold, is the best, and a line under a row says when two tie.
Combined Tolerable and Combined Goal add up each row across all the Solutions: how far they take that Value together. Combined Worst Case, shown once there is an impact, uses the worse end of each range toward Goal, then the Experience Level.
With two or more Solutions, How sure is the winner says in one sentence whether the Goal winner also wins on Goal × EL and on the Worst Case, such as Save.LocalFirst wins on Goal, on Goal × EL and on the Worst Case. Kai-Zen's rules rank the Solutions by Goal, by Tolerable and by Goal × EL and name no winner by the Worst Case, so that sentence is GilbApp's own; the table does not change for it.
Kai-Zen works out each % and never guesses it: % Tolerable is the change ÷ (Tolerable − Status), % Goal is the change ÷ (Goal − Status), with Budget in place of Goal for a Development Resource. GilbApp works out each % from the numbers on the cards; you do not type it.
Each number lives on the impact, so it is the same here, on the Solution's card and in every table that holds both. GilbApp ranks the Solutions and works out the best set; it does not choose one for you.
How far has your project come? Look first at the columns Status, Tolerable and Goal beside each Value: Status is where it stands now, so the gap to Goal is what is still to go. The cells show what each Solution is expected to bring, not what has been delivered. What each delivered step brought is in the Value Tracking Table (VTT), which follows your Values across your steps, with an ESTIMATE and an ACTUAL for each step; the answer How do I decide to keep or throw away a step's result? shows how to read it. After each step, Kai-Zen also shows you the measured Values and the next step.
To see the whole plan as a picture, with how its parts link: See: How do I read the plan as a graph?
This answer is written for a computer screen.
Source: GilbApp af0f04ee838a4d55887d2ff1f72edd49a4ff7ca0 (version.json read 2026-11-10, dirty false), read. Menu: shell/gilbAppMenuRows.ts:158-177 (Plan options incl. Table, Open the plan table: Values against Solutions, every number calculated.); RecordsCenter.tsx:128-130 (view table = PlanTable). Frame: PlanTable.tsx:1106 (title `Plan table: ${vaultName} · ${today}`), :1778-1790 (read-at, Refresh, Refreshing…), :1792-1812 (Dismiss, Dismiss all), :1838 (LevelPairControl), :1842-1858 (notices), :1866-1874 (EditKey, OrderControl unless costless, SizeControl, Full screen), :1874-1925 (full-screen layer, Close), :1926-1927 (Graphics, Best set unless costless); :1290-1302 (costless rule); :1303-1305 (order kept while the page is open, not stored). Levels: PlanTable.tsx:982-995 (LevelPairControl Levels); lib/base/planLevelPair.ts:11-33 (label <upper> to <lower>, default Product to Solution). Table: PlanTable.tsx:820-905 (heads Value, Status, Tolerable, Goal, Combined Worst Case, Combined Tolerable, Combined Goal; Winners, How sure, ratio and sum rows; ✕ Exit full screen in the corner cell), :418-516 (cell button), :947-962 (EditKey words); lib/base/planTable.ts:263-350 (cell lines), :469-489 (hasEl once any impact; How sure with two or more Solutions), :568-581 (COLUMN_ORDERS, no cost yet, order changes no number); planSure.ts:1-6 (the standards define no winner by the Worst Case), :48-60 (sentence forms); lib/base/planTableSize.ts:1-14 (Small, Normal, Large, Fit width; kept in this browser). Charts: lib/base/planCharts.ts:65 (Graphics), :93-100 (Value for money caption, No Solution to draw yet.), :143-156 (How far each Value gets caption, No Value has a number to draw yet.); PlanGraphics.tsx:84-100 (heading + caption, failure sentence), :133-148 (drawn when seen). Best set: lib/base/bestSet.ts:382-420 (heading `Best set (then Goal, within Budget): …`, Budget used:, Still below Tolerable after the set:, Reached Goal:). Columns: TableCard.tsx:186-215 (←, →, × on members), :504 (moves only on a Value Tracking Table), :707-708 (onMove only for a VTT). Also: Kai-Zen.VDTRules. GilbApp 49b1ae53 (https://gilb.com/app/version.json, read 13 November 2026): src/components/records/PlanTable.tsx:830-832 (the columns Status, Tolerable, Goal). Standard Kai-Zen.Cycle (Measure, Next). Live answer, sentences shared: How do I decide to keep or throw away a step's result? (ESTIMATE, ACTUAL).
Checked against GilbApp d529620.