
How do I score a Value that can be too high and too low?
Short answer
Search and select the Value Decision Table, press the cell, press + Add an impact, type the change, check the limits under AGAINST THE LEVELS.
Before you start
You need to be signed in to GilbApp on a computer, with a vault you can write to, such as your own vault. The Value needs Target range under Better, a Status number, and two Goal and two Tolerable rows, all with the same date, the high ones written last, each marked low or high under One side; it and the Solution must be in a Value Decision Table.
If those rows have no date, the cell says No % yet. The pictures show a made-up person on a test site; your screen shows your own name and address.
Words used here (7)
- Value Decision Table
- A Value Decision Table (VDT) is a table that ranks options by how much they move the level's Values for their cost.
- GilbApp
- GilbApp is the app, opened in a web browser at https://gilb.com/app, where you open, fill and share your vaults.
- Kai-Zen
- Kai-Zen is the planning agent: it finds out what you want, chooses the way, hands the work to other agents and reports back.
- record
- A record is one piece of data with its own address, such as a person, a place, a thing or a note.
- short name
- A short name is the one word you give one AI on one computer, such as gilb-example; it keeps that AI's key and tools apart.
- Budget
- A Budget is the most of a Development Resource you plan to use, such as the money for one month.
- Experience Level
- An Experience Level is a whole number from 0 to 10, chosen under an impact, that says how much experience stands behind its number.
Steps
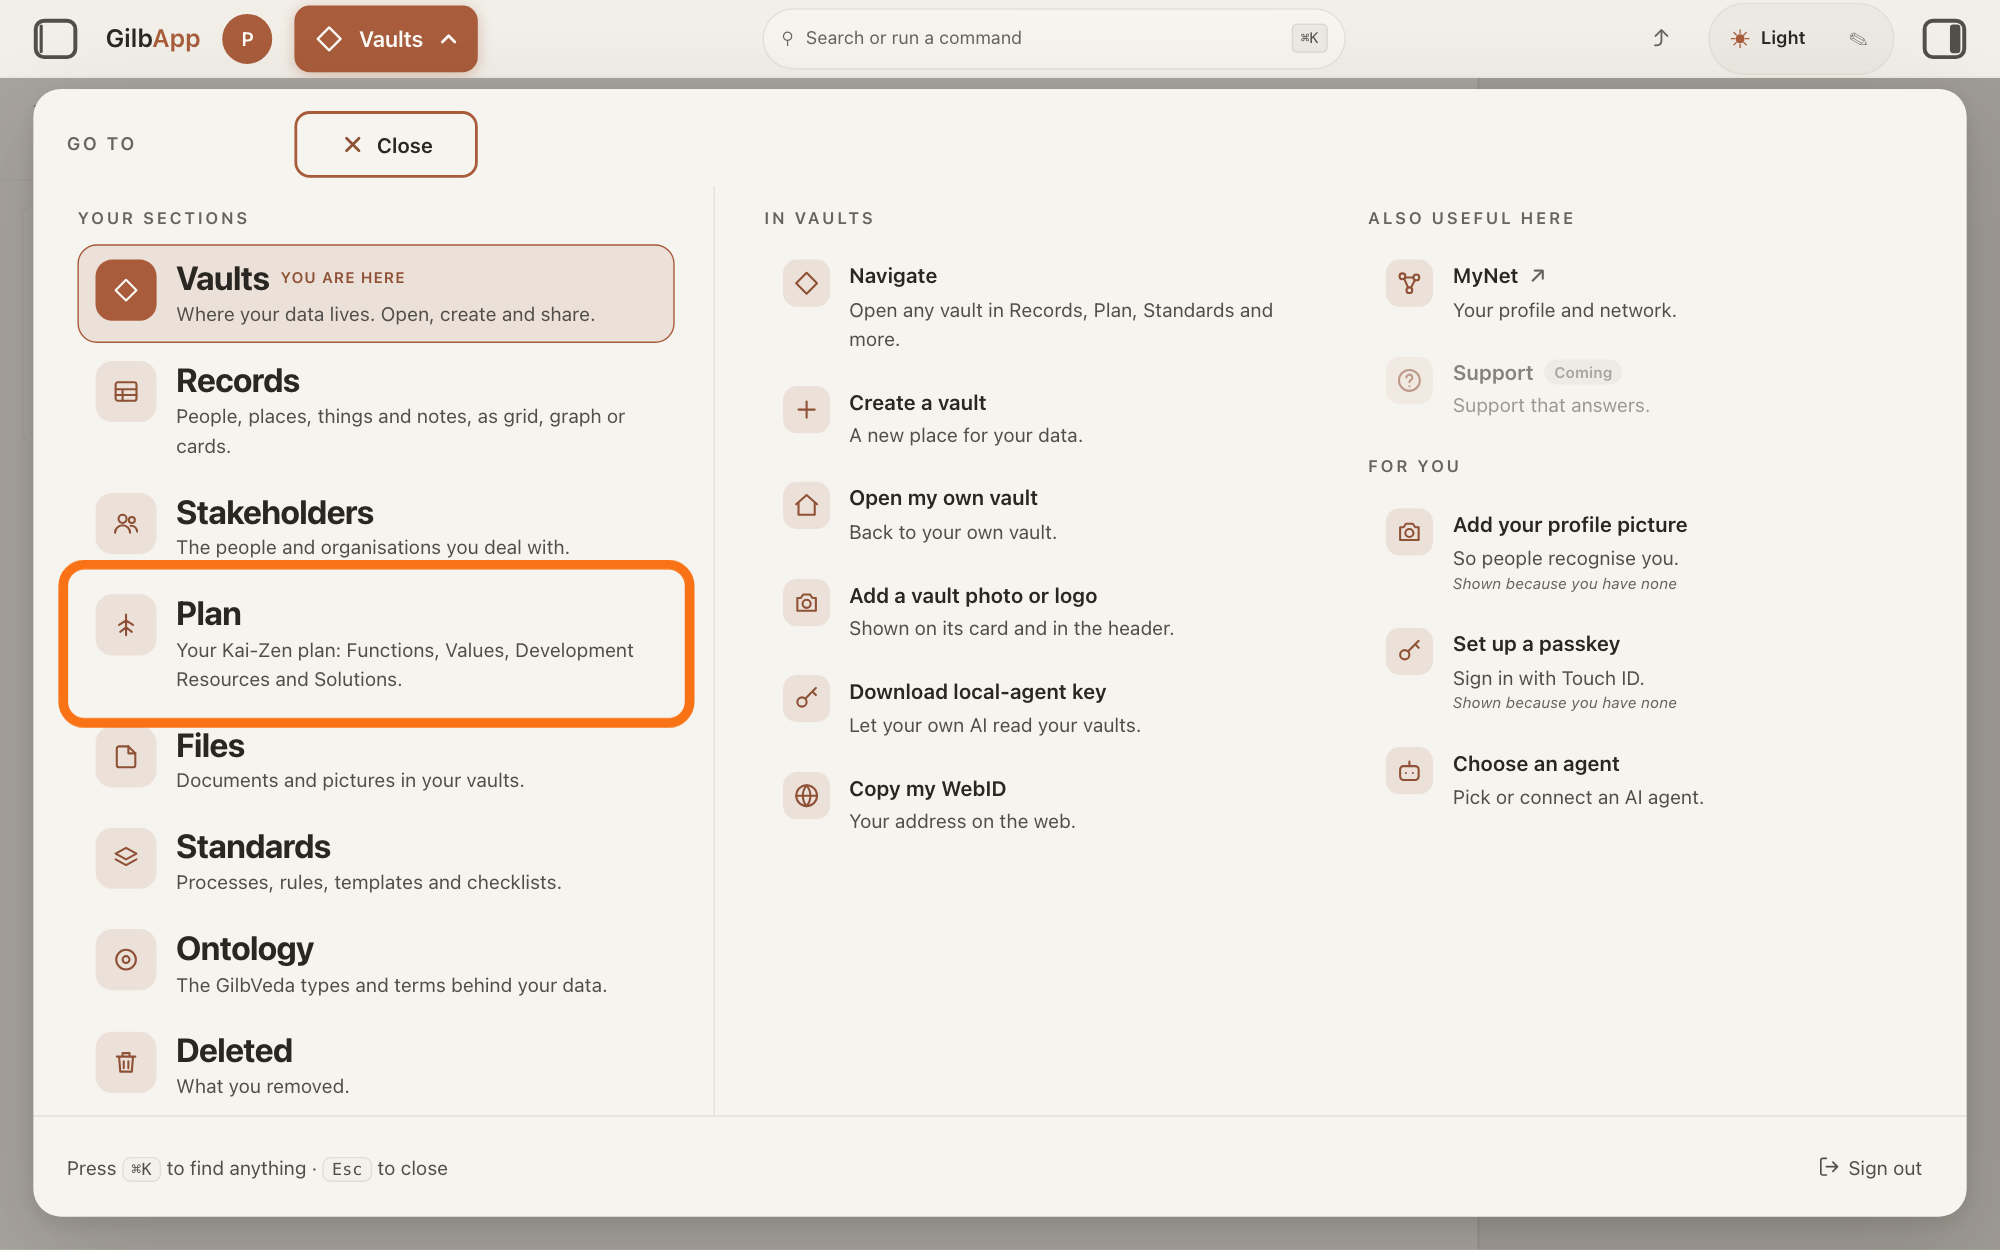
Press Main menu at the top left and choose Plan.
Press Main menu, next to your profile picture at the top left, and under YOUR SECTIONS choose Plan. The button shows the name of the section you are in, such as Vaults.
Show as text
In the GO TO panel that opens from "Main menu" at the top left, look under YOUR SECTIONS on the left. The outlined row is "Plan", with the line "Your Kai-Zen plan: Functions, Values, Development Resources and Solutions." Press it to open the Plan screen.
More about this
A panel headed GO TO opens; Plan reads Your Kai-Zen plan: Functions, Values, Development Resources and Solutions. You can also press the Plan button on the card of a vault (the place where a person or a group keeps their records) in Vaults. The Plan screen lists your plan records and has the views Grid, Graph, Both and Card.
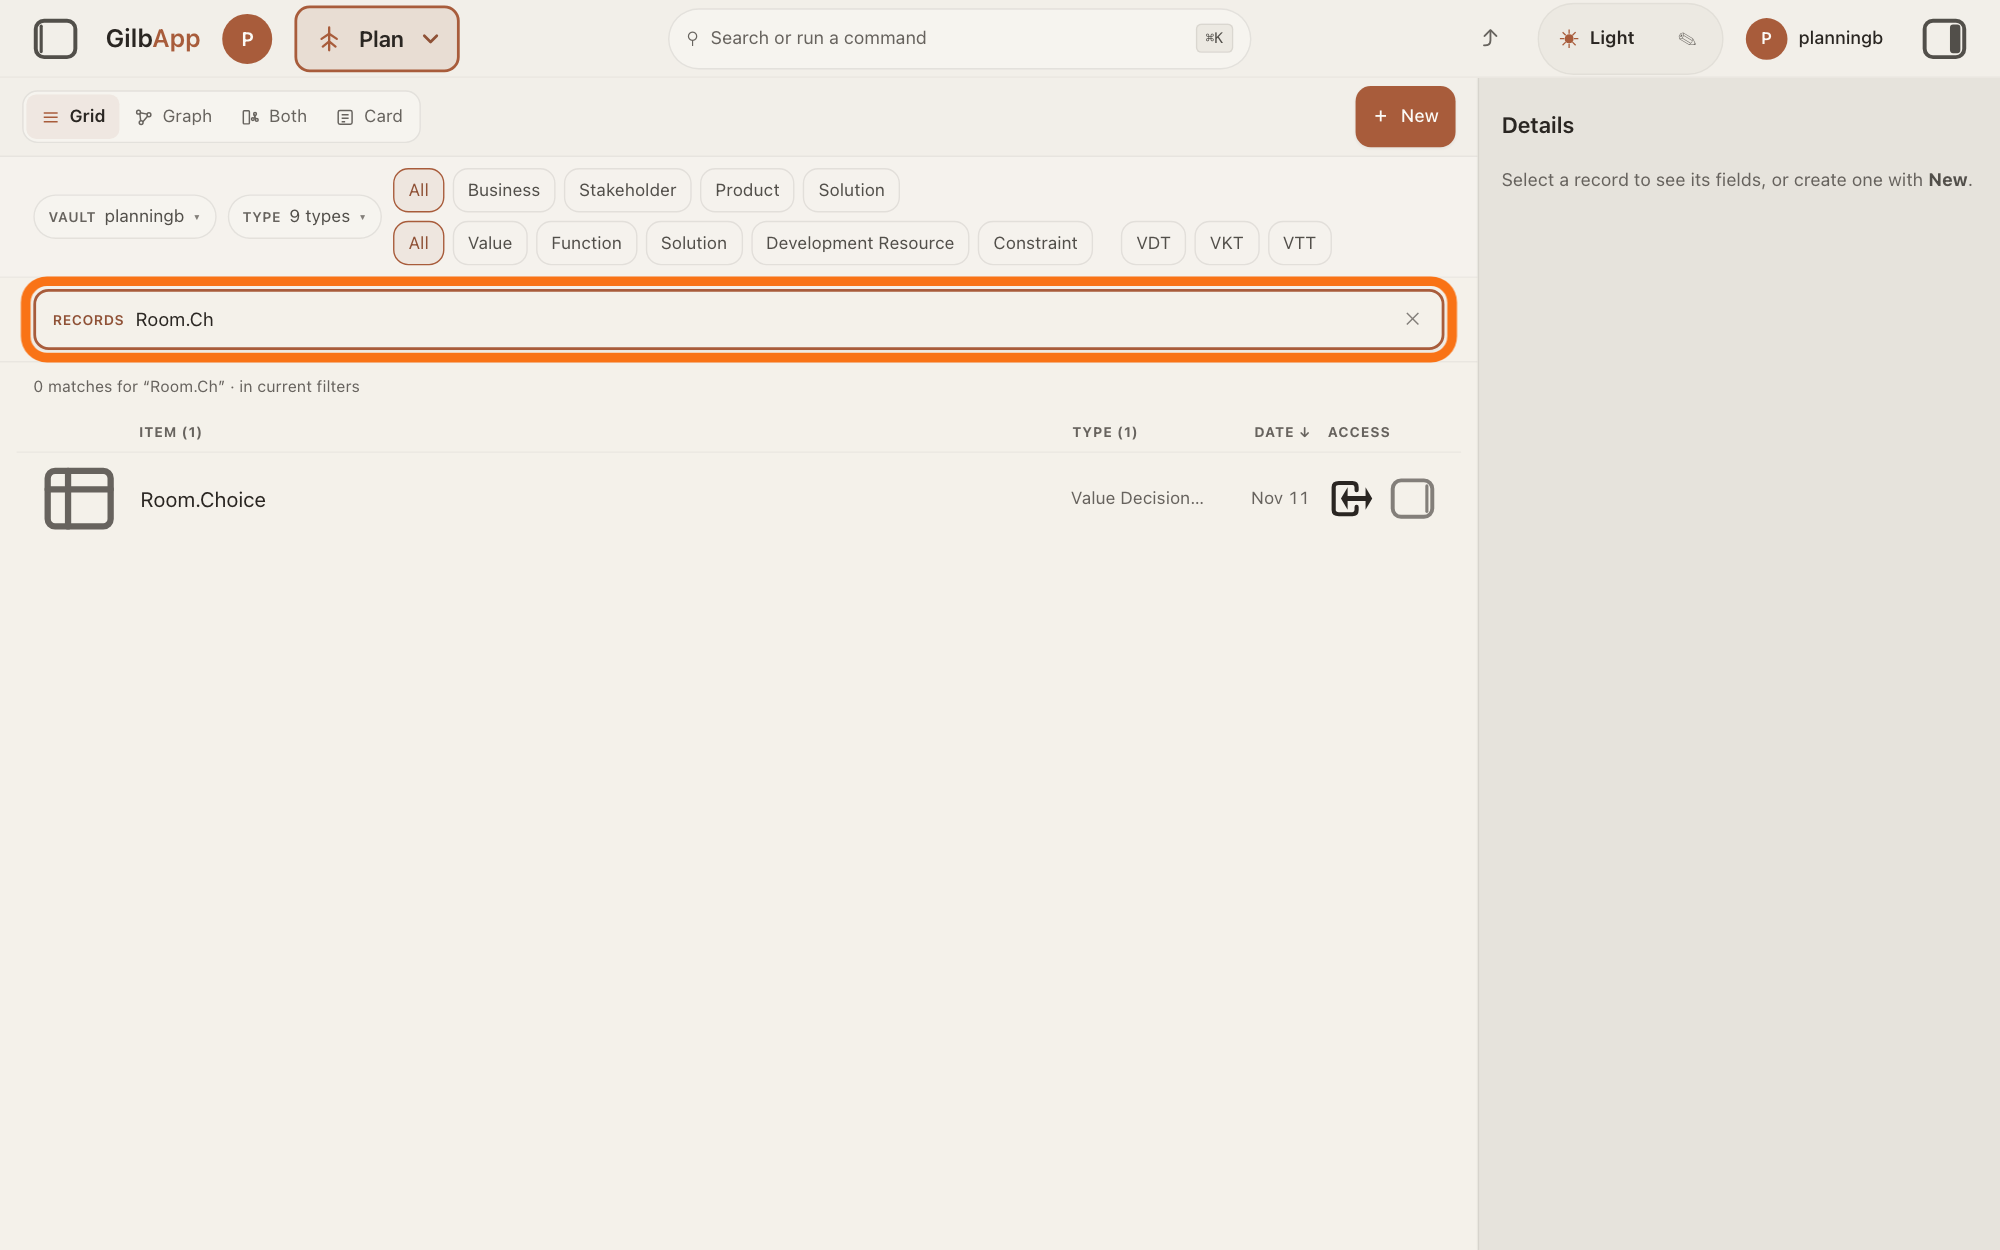
Search and select the Value Decision Table in the list.
Type part of the table's tag (its short name) in the search box and select the Value Decision Table in the list. The table opens in the middle of the screen.
Show as text
On the Plan screen, the "RECORDS" search box above the list holds the start of the table's tag, and the list shows one row of type Value Decision Table. The search box is outlined. Type there, then click the table's row.
More about this
A Value Decision Table (VDT) is a table that ranks options by how much they move the level's Values for their cost. If the table shows in the right pane instead, press Open the table there. The search box shows Search in current filters… while a filter is on, and Search your vault… otherwise. The button VDT in the row of kinds shows only Value Decision Tables.
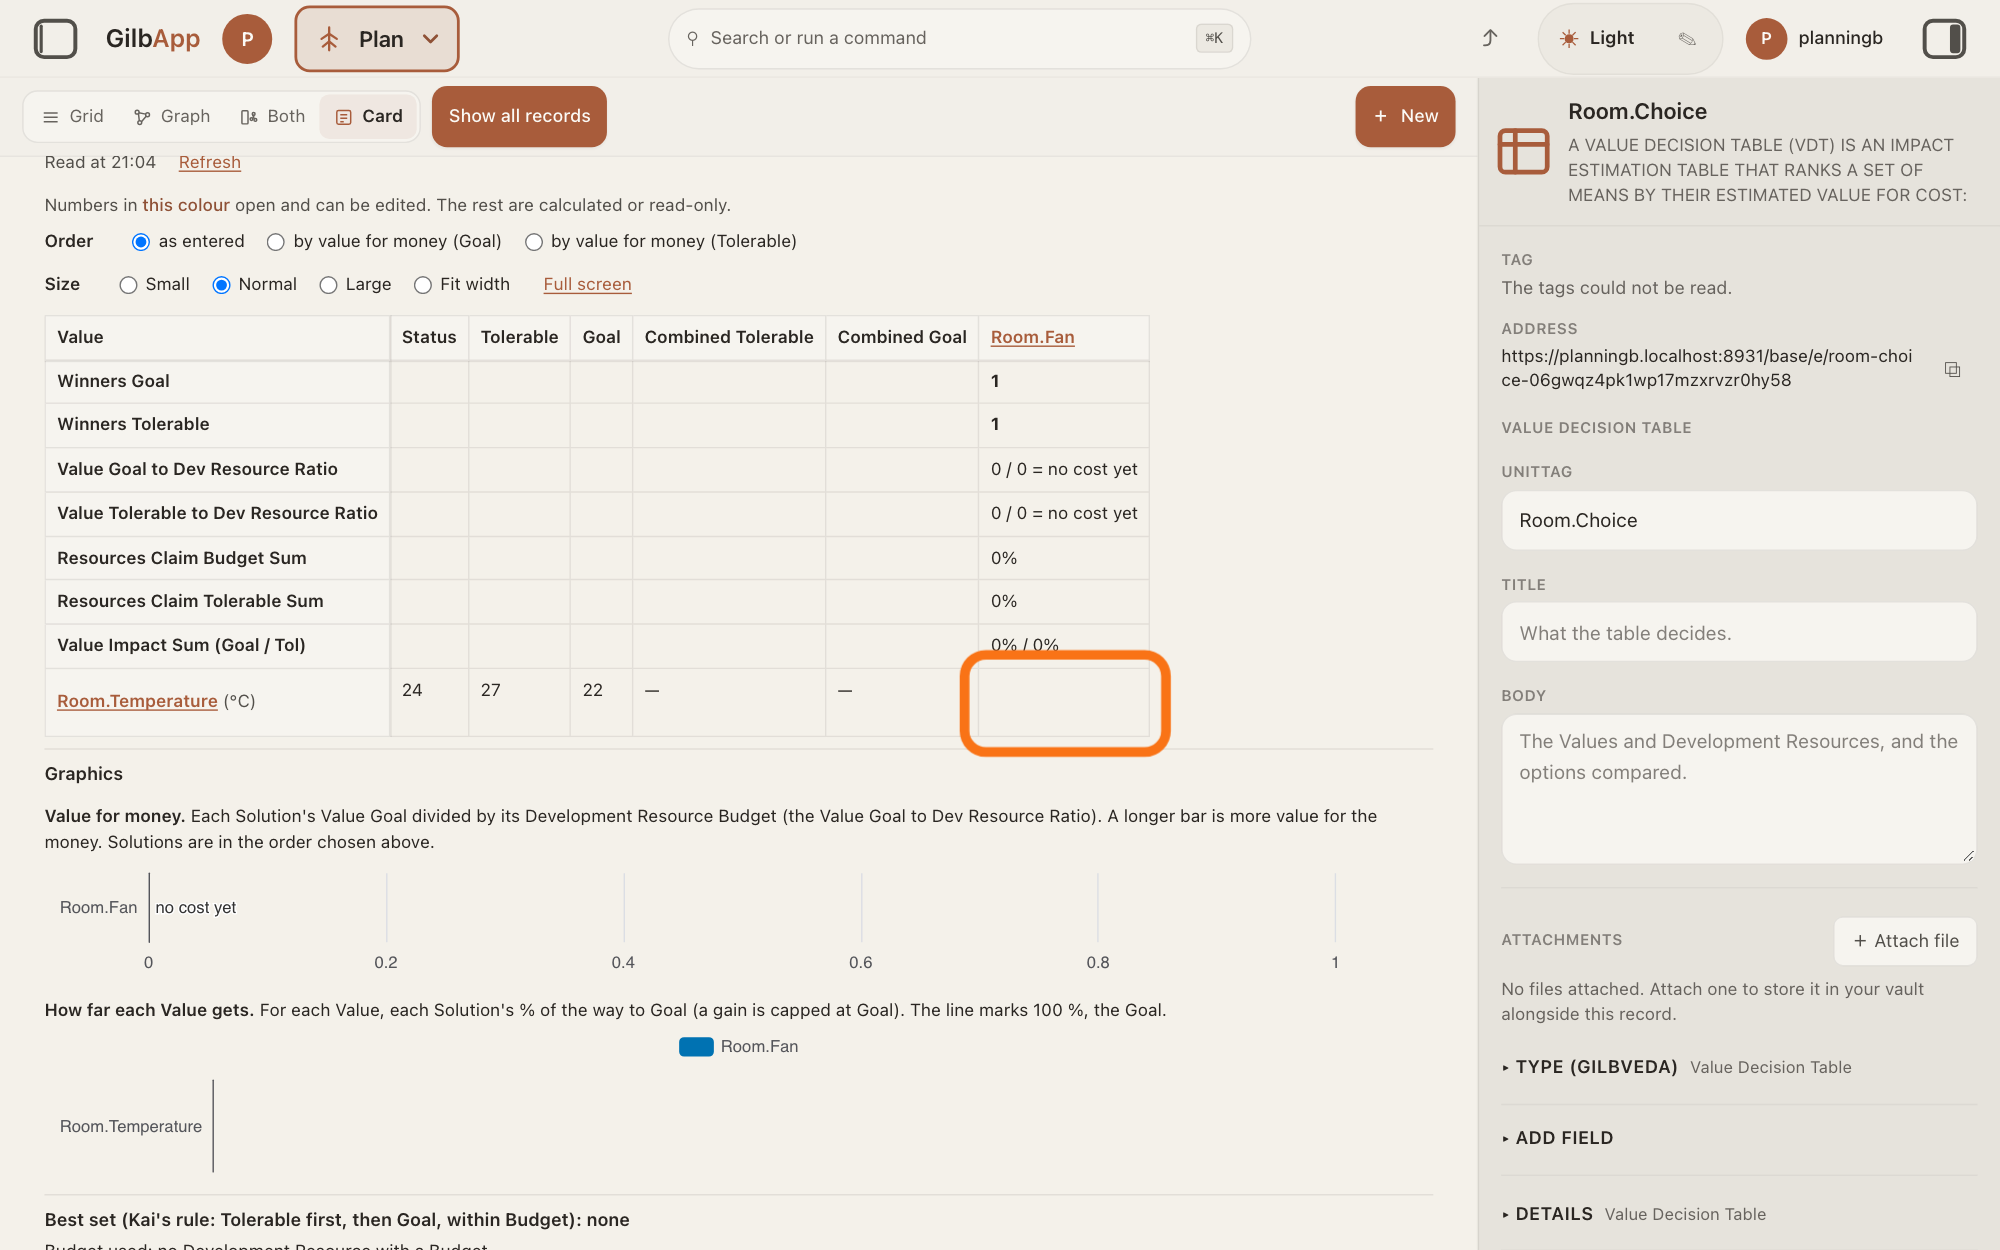
Press the cell where a Solution meets a Value.
Press the cell in a Solution's column and a Value's row. The right pane opens under IMPACTS, headed by the Solution's tag, → and the Value's tag.
Show as text
The table is open in the middle. The Value's row, below the sum rows, shows its "Status", "Tolerable" and "Goal" numbers. The outlined cell is in the Solution's column on that row and is still empty. Click it.
More about this
An empty cell shows + when you point at it. An impact, the effect a Solution has on a Value or a Development Resource, fills its cell by itself once written on the Solution's card: the change, then Tol and Goal with a % (how much of the way from Status to Tolerable, and to Goal, that Solution alone goes; a Resource's cell shows Tol and Bud, toward its Tolerable and Budget), EL (the Experience Level) with its number, and the evidence. With no Tolerable or Goal on the Value, the cell says No % yet. The line above the table says "Numbers in this colour open and can be edited. The rest are calculated or read-only.", or You can open every number to read it. None can be edited here. A Solution, Value or Resource name in the table opens its card in the right pane instead.
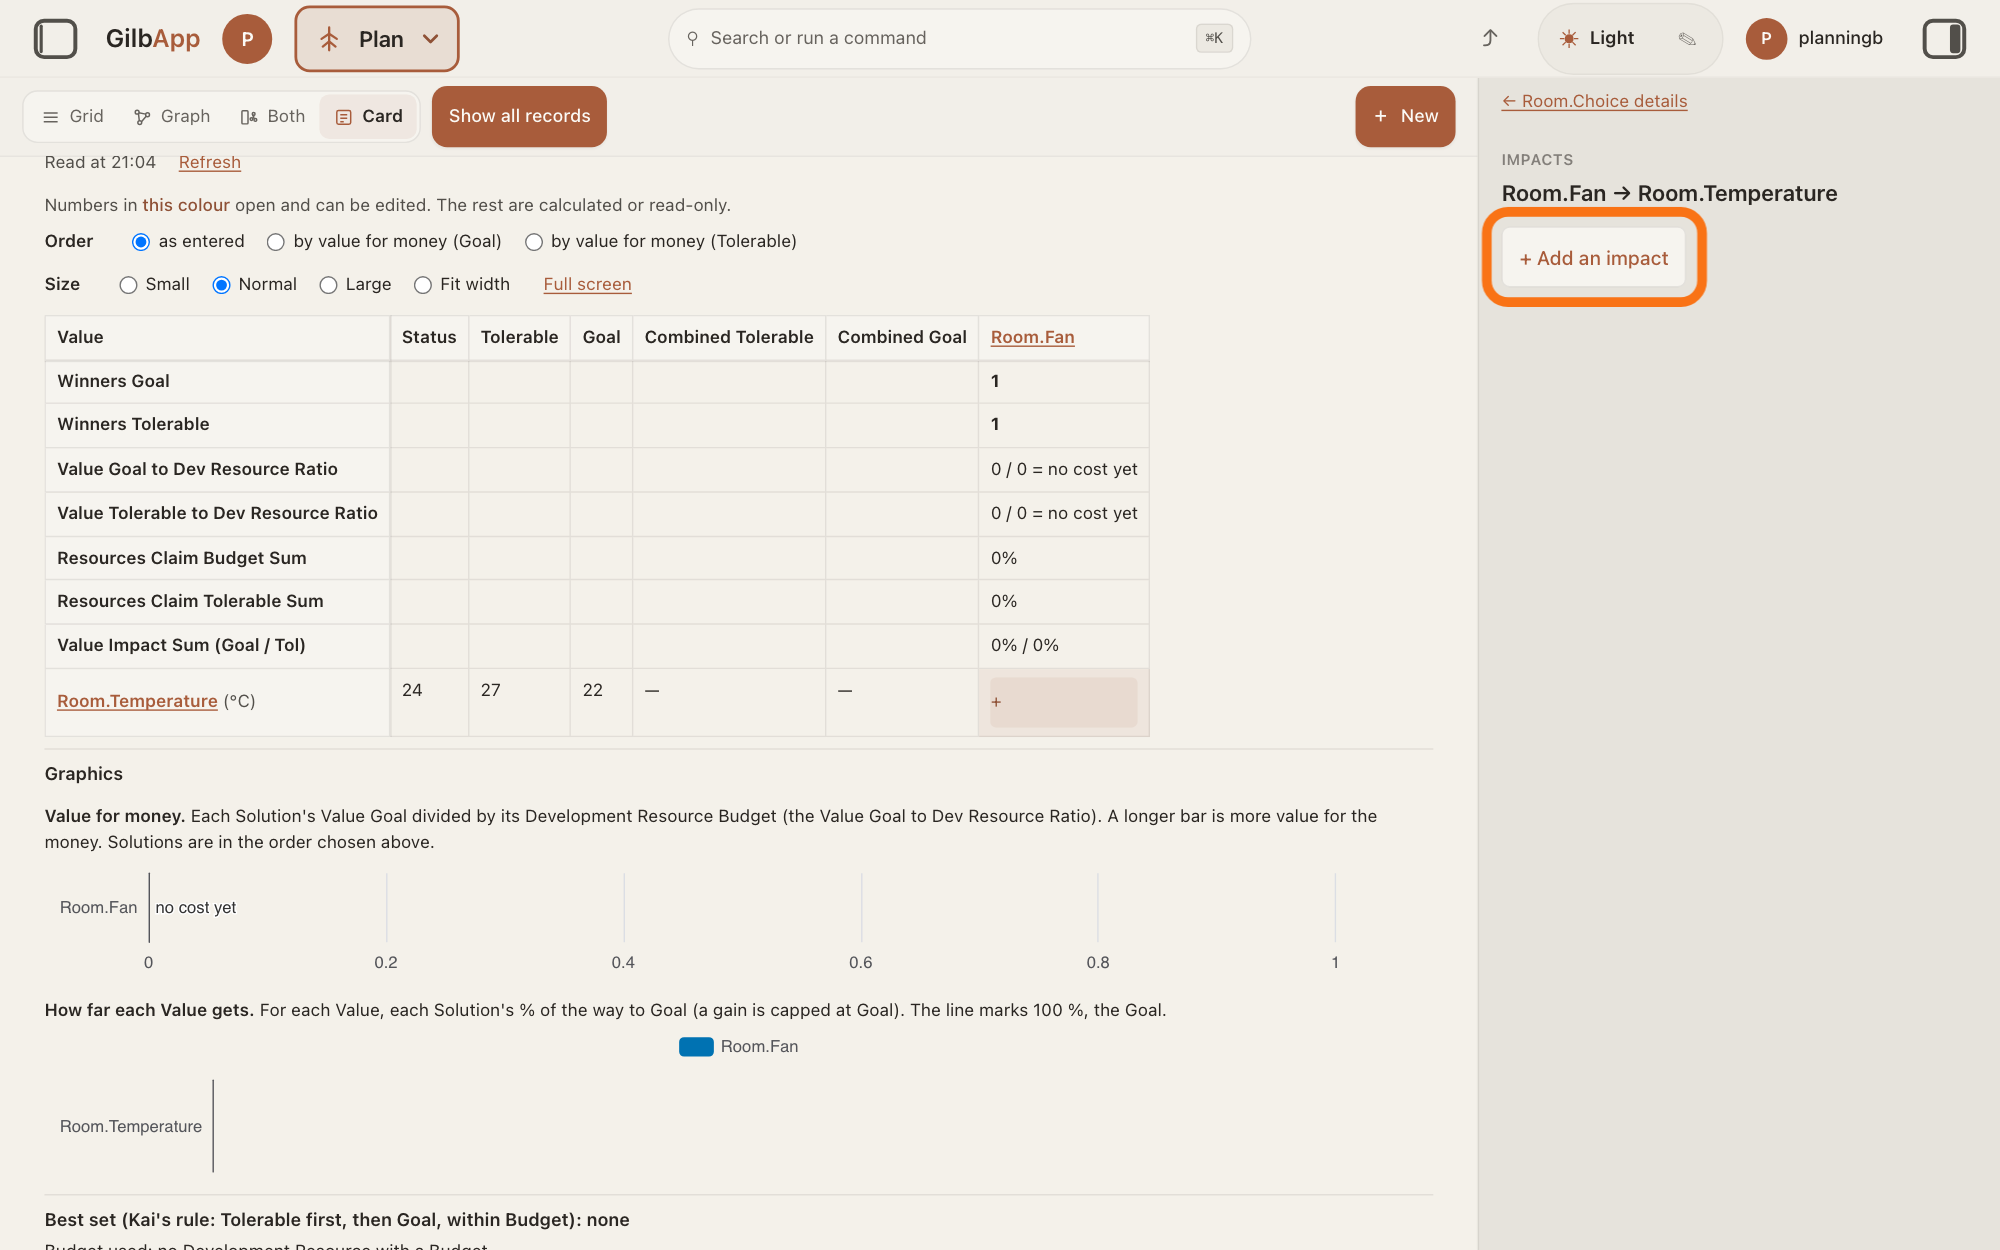
Press + Add an impact, type the change and press Enter.
In the right pane, press + Add an impact, type the change the Solution brings, such as -2, and press Enter. You type the change, not the end number: -2 on a Status of 24 makes 22.
Show as text
The right pane opens. Under "IMPACTS" the heading names the Solution, an arrow and the Value. Below it, the outlined button is "+ Add an impact". Press it, type the change, for example -2, and press Enter.
More about this
GilbApp then works out the % in the cell and under AGAINST THE LEVELS; you do not type it. In the Kai-Zen method a Value with a low and a high limit is scored against the limits on the side where its Status is. Inside the Goal band, between the low and the high Goal, a change that keeps it there scores 0; a change out of the band is a loss, as a share of the distance from that Goal to the Tolerable beyond it. Above the band, as here, the high Goal and Tolerable count: -2 reaches the Goal of 22, 100 % of the way. The pane also shows CHANGE and, at its foot, Remove this impact; HOW SURE and EVIDENCE are as in the answer on comparing Solutions in a VDT. You need none of them here.
Under AGAINST THE LEVELS, check the limits the % rests on.
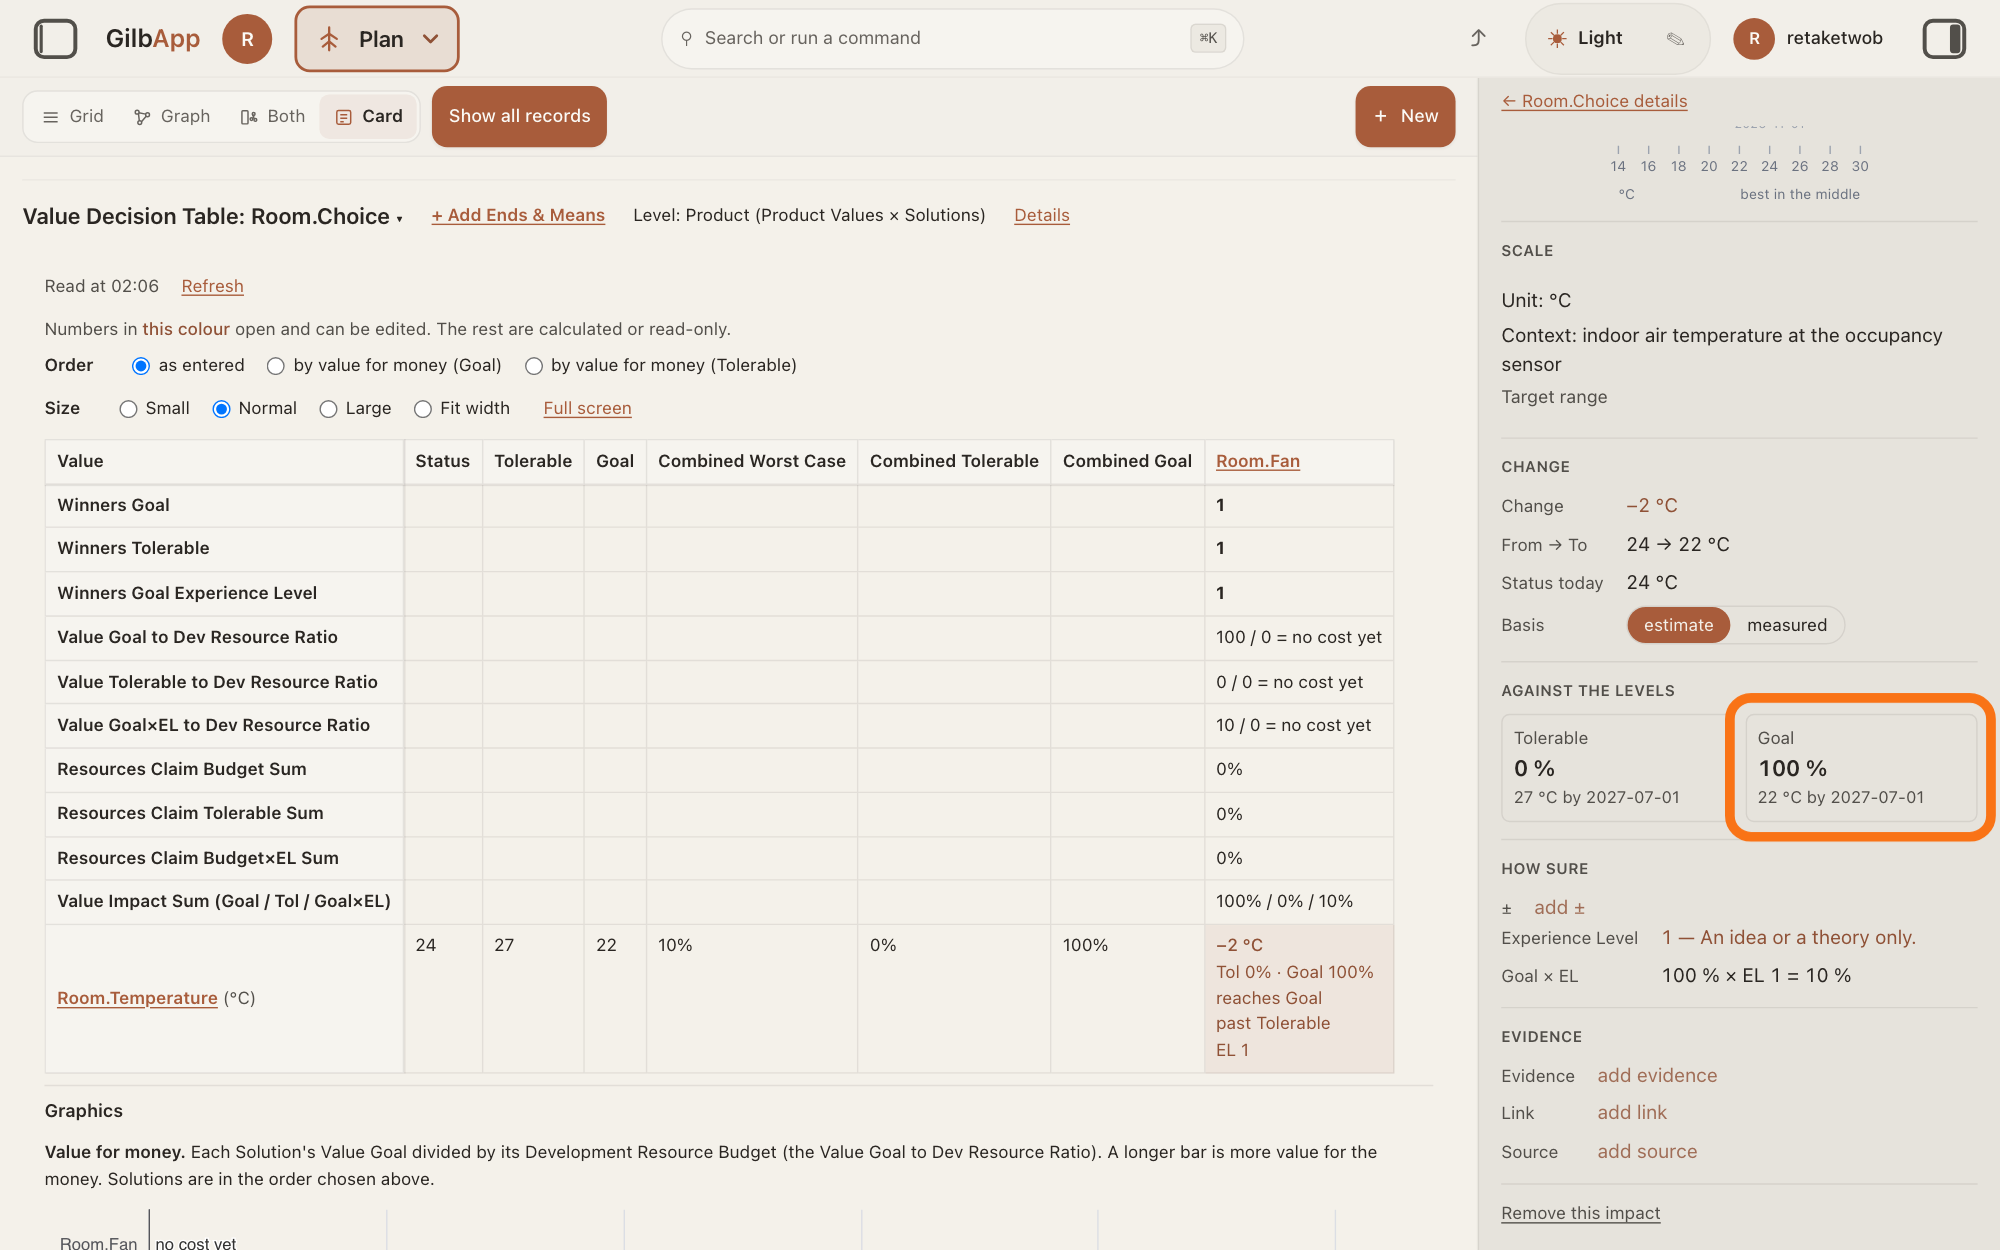
Under AGAINST THE LEVELS, read the Tolerable and Goal tiles: each shows its % and, under it, the limit it rests on, such as 22 °C by 2027-07-01. When the Status and the change stay inside the band or on the side of those limits, the Goal tile's % is the Kai-Zen score; the Tolerable tile reads 0 % while the Value stays better than that limit.
Show as text
In the right pane, under "CHANGE", the change reads -2 °C and "From → To" 24 → 22 °C. Under "AGAINST THE LEVELS" are two tiles: "Tolerable" 0 % with 27 °C by 2027-07-01, and the outlined "Goal" 100 % with 22 °C by 2027-07-01. Check which limits these % rest on.
More about this
GilbApp today chooses one Goal and one Tolerable by date, as for any Value; with the same date, the later row of each kind. It does not read One side, and it does not look at which side the Status is on. Example, with the high limits chosen and a Status of 21, inside the band: a change of -3, to 18, shows 0 %, while the Kai-Zen score is a loss of (20 − 18) ÷ (20 − 16), −50 %. Deeper, below the steps, has more.
Deeper
Also asked:
What if something can be too much and too little? Give its Value Target range under Better: the aim is a band. It has four limits, from the lowest up: Tolerable low, Goal low, Goal high, Tolerable high, such as a room at 16, 20 to 22 and 27 °C.
A Value that can be too high and too low has Target range under Better: the aim is a band, not lower or higher. It has a low and a high limit of each kind. From the lowest number up: Tolerable low, Goal low, Goal high, Tolerable high. Example: room temperature, in °C at the room's sensor: Tolerable 16, Goal 20 to 22, Tolerable 27. The answer on setting a Goal and a Tolerable level shows how to write the four limits.
In the Kai-Zen method its % are worked against the limits on the side where the Status is: % Goal is the change ÷ (Goal − Status), and % Tolerable the change ÷ (Tolerable − Status). With a Status of 24, above the band, the high Goal 22 and Tolerable 27 count, and a change of -2 is 100 % of the way to Goal. Inside the band, a change that keeps the Status there scores 0, and a change out of the band is a loss, as a share of the distance from that Goal to the Tolerable beyond it. With a Status of 21: a change of +3, to 24, is −40 %, (24 − 22) ÷ (27 − 22); a change of -3, to 18, is −50 %, (20 − 18) ÷ (20 − 16).
GilbApp works the % from one Goal and one Tolerable, chosen as for any Value: of those with one plain number, the one dated nearest on or after today, else the latest dated; with the same date, the later row. It does not read One side and does not look at which side the Status is on. So its Goal % matches the Kai-Zen score only while the Status and the change stay inside the band or on the side of the limits it chose; on the other side it shows 0 % where Kai-Zen counts a loss or a gain. Pressing a cell shows the limits it chose under AGAINST THE LEVELS. When Kai-Zen builds a Value Decision Table, it works out each % by its rules and never guesses it.
The answer on comparing Solutions in a VDT shows the rest of the table.
This answer is written for a computer screen.
Source: GilbApp af0f04ee838a4d55887d2ff1f72edd49a4ff7ca0 (https://gilb.com/app/version.json read 2026-11-10, buildTime 2026-11-09.522Z, dirty false), read (no checkout, no copy). step 2 with the VDT gloss of (recordsView.ts:76-84, table in the middle; RecordDetail.tsx:2209-2210 Open the table; RegisterScopedSearch.tsx:73-74; planFilterRows.ts:19-29 kinds incl. VDT); steps 3 headline and details word for word (PlanTable.tsx:418-516; planTable.ts:263-350). Step 4: PlanImpacts.tsx:1912-1945 (+ Add an impact); Percent: valuePercent.ts:54-102 (cellPercent: one Tolerable and one Goal; the Band branch :85-91 for a Status at or past Goal), :120-126 (percentLine); valueLimits.ts:40-64 (chooseLimit: kind, plain number, date; same date: the later in order; side, conditions and qualifier choices not read), :100-129; planValue.ts:1668-1680 and :1655 (new rows take the next order). Ported cellPercent by hand (Python, not stored) for the cases on the page: Status 24, change -2, high pair (22, 27): 100 %, reaches Goal; Status 21, change +3, high pair: -40 %; Status 21, change -3, high pair: 0, at Goal; with the low pair (20, 16) the -3 case is -50 %. Tiles: PlanImpacts.tsx:815-820 (Against the levels, uppercase by PlanImpactPane.tsx:291); PlanImpactPane.tsx:503-512 (Tolerable and Goal tiles: % and <number> <unit> by <date>). Level row: PlanValueLines.tsx:105 (Target range), :2533-2545 (One side, low, high only for target). Standards (2026-11-10): Kai-Zen.VDTRules.Band ("For a Value with a low and a high limit, work % Goal and % Tolerable against the limits on the side where Status is. If Status is inside the Goal band, a move that keeps it there is 0; a move out of the band is a loss, as a share of the distance from that Goal limit to the Tolerable limit beyond it."), .Percent; Kai-Zen.ValueRules.Bipolar (Tolerable low ≤ Goal low ≤ Goal high ≤ Tolerable high.), .Better (Use target when the Value has a low and a high limit.); Kai-Zen.ValueTemplate.Example.Bipolar (RoomTemperature: Tolerable low 16, Goal low 20, Goal high 22, Tolerable high 27, Status 24; °C at the occupancy sensor). GilbVeda public read 2026-11-10: t:LevelSide (THE END OF A TWO-ENDED SCALE A LEVEL BELONGS TO: the token 'low' or 'high'), t:ScaleDirection ('target': a number inside a stated range is best). Live cap 10 pictures (brief). the Tolerable tile reads 0 % for a Status at or better than the chosen Tolerable while the change keeps it there (valuePercent.ts:74 startAtTol, :86-91 band branch, pt = fT(end) - fT(Status) = 0, :100 tolState past; PlanImpactPane.tsx:509 tile = pct(tolPct), 0 %; hand port: Status 24, change -2, high pair: Goal 100 %, Tolerable 0 %, where VDTRules.Percent gives -2 / (27 - 24) = -67 %), so the claim is narrowed to the Goal tile (Goal-tile cases re-ported: Status 24 to 23, 50 %; 24 to 25, -50 %; 21 to 24, -40 %; 21 to 28, -120 %; each equal to the Kai-Zen score). Before you start: the four rows share one date and the high ones are written last, because GilbApp takes, on the same date, the later row of each kind (valueLimits.ts:52-58) and a limit with no date only when it is the only one of its kind (valueLimits.ts:62), else no limit and the cell notes No % yet (planTable.ts:328-331); a new row takes the next order (planValue.ts:956-963 readLevelRecords by a:elementOrder; :2061-2077 sortLevels keeps groups in first-seen order).
Checked against GilbApp d529620.